No products in the cart.
Article
2023 U.S. CERAMIC TILE MARKET UPDATE
2023 U.S. CERAMIC TILE MARKET UPDATE
April 01, 2024, Andrew Whitmire, TCNA (USA)
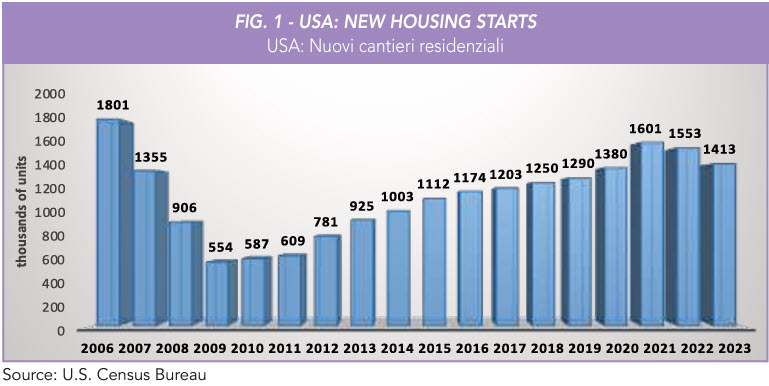
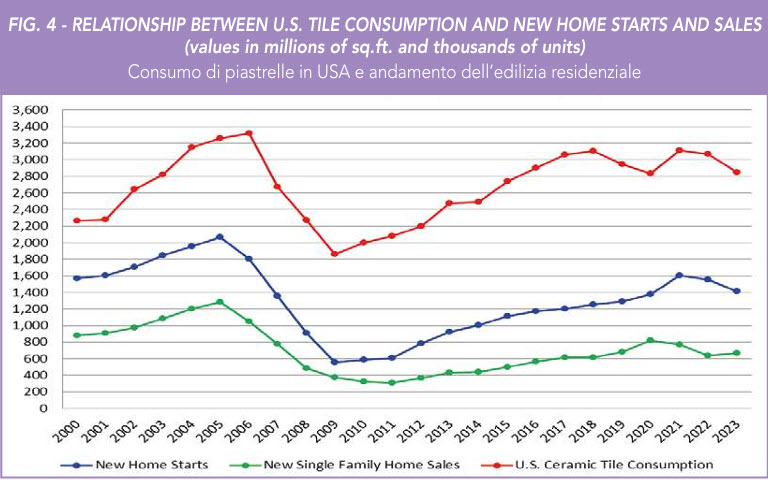
The U.S. ceramic tile market contracted for the second straight year in 2023, as the U.S. housing market with which it is closely linked continued to struggle due to high mortgage rates, inflation, and labor shortages. In the residential market, total new home starts declined in consecutive years for the first time since 2009 during the Great Recession. The 1.41 million units started in 2023 represented a 9.0% decrease from the preceding year. According to U.S. Census Bureau, single-family new home starts, which comprised 66.8% of total 2023 home starts, fell 6.0% from the prior year to 944,500 units. Multi-family starts were down 14.4% from 2022 to 468,600 units. Looking ahead, the National Association of Home Builders (NAHB) forecasts 2024 total housing starts to decrease 3.4% to 1.37 million units, with single-family starts rising 4.7% but multifamily starts decreasing 19.7% from 2023.
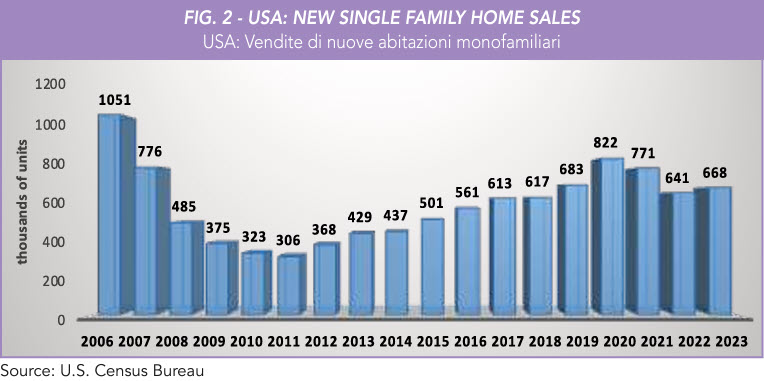
Existing single-family home sales in 2023 were at 3.66 million units, down 18.3% vs. the previous year and the lowest annual total since 1995. In addition to high mortgage rates hampering sales, the average sales price reached a new all-time high of $394,600. Existing home sales impact remodeling. The rooms most often remodeled are kitchens and bathrooms, which are also the spaces where tile is most frequently used. Although new home sales rose for the first time in three years (+4.2% vs. 2022), they have still not recovered from the Great Recession and were down 47.9% from the record-high of 1.28 million units sold in 2005 (source: U.S. Census Bureau).
U.S. foreclosure filings, a key inverse indicator of the housing market’s health, were up 10.1% vs. 2022. While rising for the second year in a row, foreclosure filings remained at a very low level historically and were down 87.6% from the peak level of 2.9 million in 2010. The 357,000 foreclosure filings in 2023 affected 0.26% of all U.S. housing units (source: ATTOM Data Solutions).
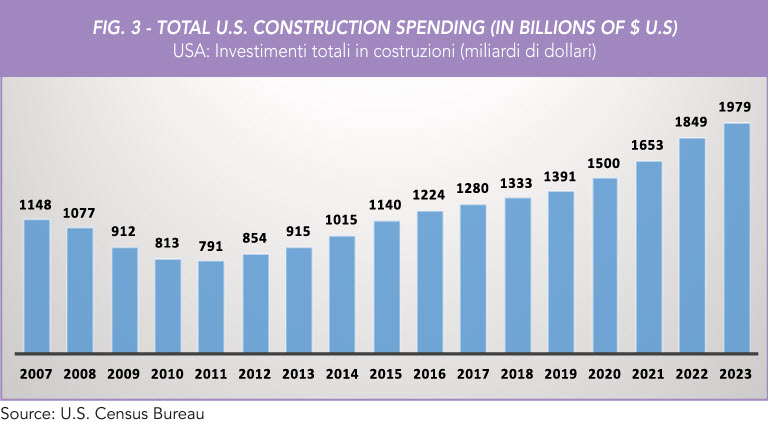
Mortgage rates rose significantly in 2023 and were at an annual average of 6.81% (30-year fixed). This was the highest annual rate in more than two decades, or since 2001 (source: Freddie Mac). On a positive note, total U.S. construction spending (includes private and public residential and non-residential construction) last year reached an all-time high of $1.98 trillion, up 7% from the prior year (source: U.S. Census Bureau).
U.S CERAMIC TILE PRODUCTION AND CONSUMPTION
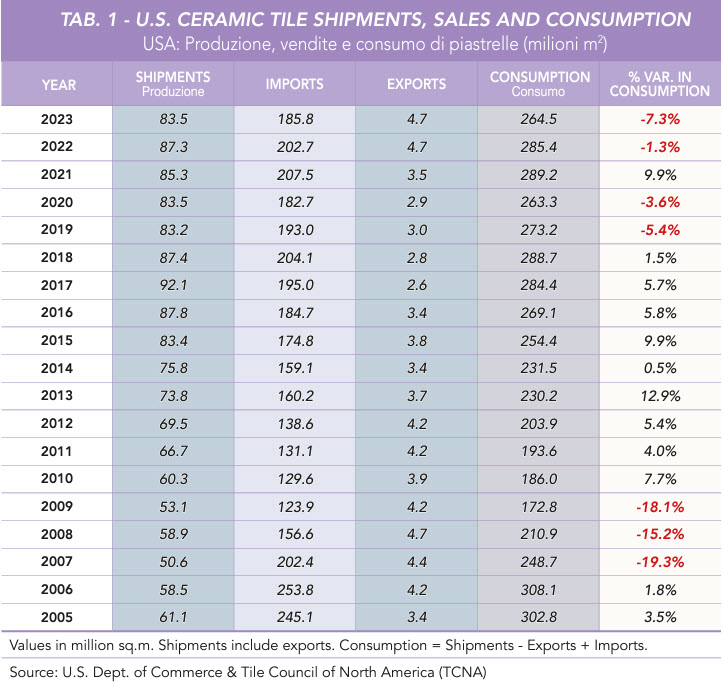
Based on figures from U.S. Dept. of Commerce and Tile Council of North America, total U.S. ceramic tile consumption in 2023 was 264.5 million m2 (2.85 billion sq. ft.), down 7.3% from the previous year. The volume of domestically produced tile decreased from 87.3 million sq.m to 83.5 million sq.m, -4.4% from 2022. U.S. manufacturers shipped 78.7 million m2 (847.3 million sq. ft.) of ceramic tile domestically in 2023, down 4.7% from the previous year.
By volume, U.S. shipments’ share of total U.S. consumption was 29.8% in 2023, up from 28.9% the prior year, and was much higher than the shares of any individual country exporting to the U.S., with the next highest shares of total consumption belonging to India (14.2%), Spain (12.2%), and Mexico (11.8%). In dollars, U.S. FOB factory sales of domestic shipments in 2023 were $1.50 billion, a 1.7% increase from the prior year. U.S. shipments were 36.9% of total 2023 U.S. tile consumption by value, up from 33.4% in 2022. The per unit value of domestic shipments in 2023 was $19.06/m2 ($1.77/sq. ft.), up from $17.86/m2 ($1.66/sq. ft.) in 2022.
U.S. ceramic tile exports in 2023 were 4.7 million m2 (51 million sq. ft.), up 0.5% from the previous year and the highest total on record. The vast majority of these exports went to Canada (65.8%) and Mexico (19.7%). U.S. exports by value in 2023 were $53.3 million, up 1.4% from 2022.
IMPORTS
According to figures by the U.S. Dept. of Commerce, U.S. ceramic tile imports were at 185.8 million m2 (2.00 billion sq. ft.) in 2023, an 8.4% decline from the prior year. While many of the largest tile exporters to the U.S. experienced double-digit year-over-year percentage declines, imports from India soared 42.6% by volume, from 26.4 in 2022 to 37.6 million m2 in 2023. With a 20.3% share of U.S. imports, India also became the largest exporter to the U.S. on a volume basis for the first time, replacing Spain, which had held the top spot since 2020. Spain was the second largest exporter to the U.S. in 2023 even though its volume fell 19.4% compared to the previous year. Spanish imports held a 17.4% share of 2023 total U.S. imports by volume, down from 19.8% in 2022.
Mexico remained the third largest exporter to the U.S. by volume in 2023 with a 16.7% share of total U.S. imports. Imports from Mexico by volume declined 7.8% vs. 2022. While Italy was the fourth largest exporter to the U.S. in 2023 by volume, its exports to the U.S. were down 20.5% vs. the prior year. Italy’s share of imports fell from 17.3% in 2022 to 15.0% in 2023, its lowest import share on record. Brazil replaced Turkey in the fifth spot despite seeing its exports to the U.S. fall 18.6% vs. 2022. Brazilian tile made up 9.2% of U.S. imports in 2023, down from 10.4% the preceding year.
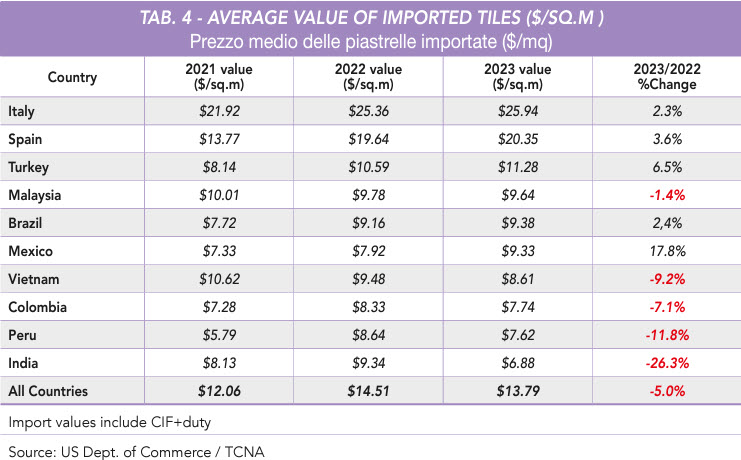
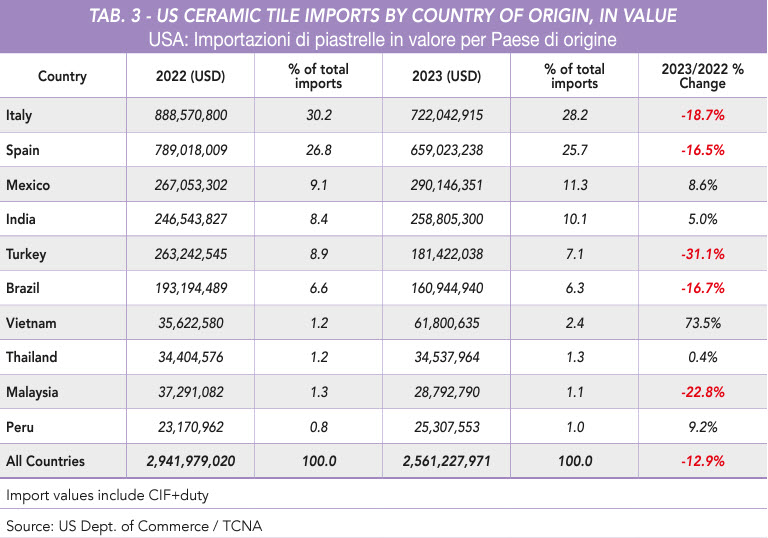
In 2023, the total value of ceramic tile imports decreased by 12.9% to US$ 2.56 billion. On a dollar basis (CIF + duty), Italy kept its place as the largest exporter to the U.S., making up 28.2% of 2023 U.S imports (US$ 722 million, -18.7%), followed by Spain with a 25.7% share (US$ 659 million, -16.5%) and Mexico with an 11.3% share (US$ 290 million, +8.6%).
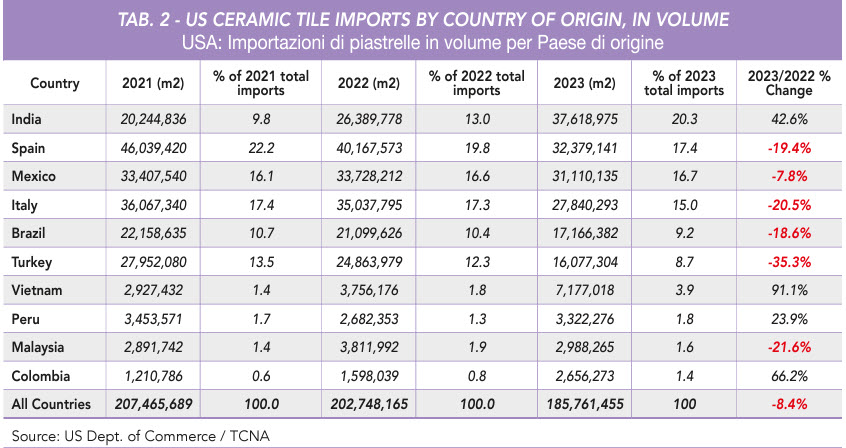
Table 4 shows the average values of tile (CIF + duty) from the ten largest exporting countries (based on volume) in 2023. These values are significantly affected by the mix of tiles imported, with different types of tiles impacting the average value, in addition to differences in pricing for the same types of tile. Once again in 2023, Italian tiles had the highest average price of $25.94/sq.m, up 2.3% from $25.36/sq.m in 2022. Spanish average value also increased by 3.6% from $19.64/sq.m to $20.35/sq.m. On the contrary, the average price of Indian tiles decreased by 26.3%, from $9.34/sq.m in 2022 to $6.88/sq.m in 2023.
CANADIAN MARKET UPDATE
According to figures from Statistics Canada, Canadian ceramic tile consumption last year was 31.3 million m2 (336.7 million sq. ft.), down 21.1% from 2022. As there is no significant ceramic tile production in Canada, imports approximately equal consumption. The five countries from which the most tiles were imported into Canada in 2023 based on volume were: China (8.9 million sq.m, +6.3% in volume; and -2.2% in value); Italy (7 million sq.m, -20.3%; and -16.2% in value); Spain (3.9 million sq.m, -33.4%; and -11.2% in value); Turkey (3.4 million sq.m, -50.5%; and -39.7% in value); and India (3 million sq.m, -30.8% and -32.9% in value). ◼
