
Article
Thursday, August 27, 2026 from Stone World
Thursday, August 27, 2026 from Stone World
By Jason Kamery

U.S. exports of natural stone and building stone products totaled $15.7 million in May, down 5.5% from the same month a year earlier, according to data from the U.S. International Trade Commission.
The figure covers stone products measured by free-alongside-ship value and excludes raw quartz and quartzite. It marked the highest monthly export total so far in 2026, though the year-over-year comparison remained negative for a third consecutive month.
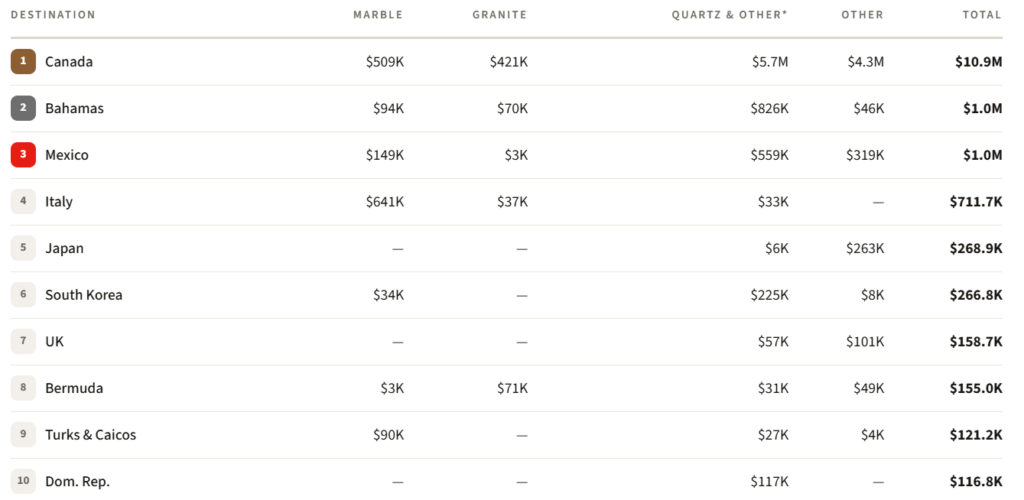
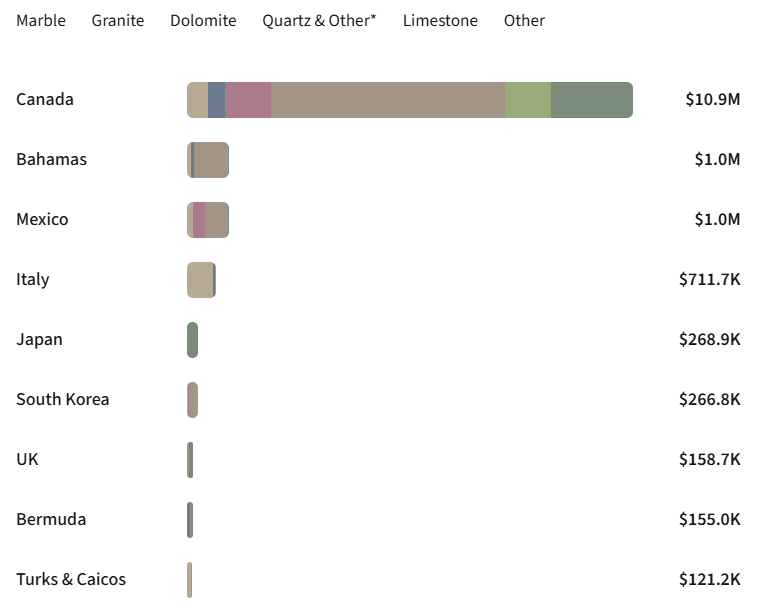
Canada again dominated as a destination, taking $10.9 million, or 69.3% of all U.S. stone exports, its largest share of the year. The Bahamas and Mexico followed at roughly $1 million each, and Italy ranked fourth at $712,000. U.S. producers shipped to 48 countries during the month.
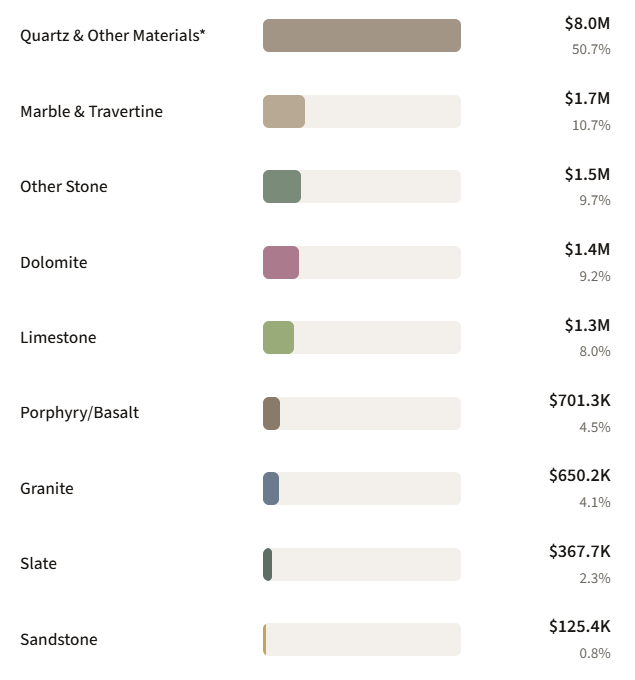
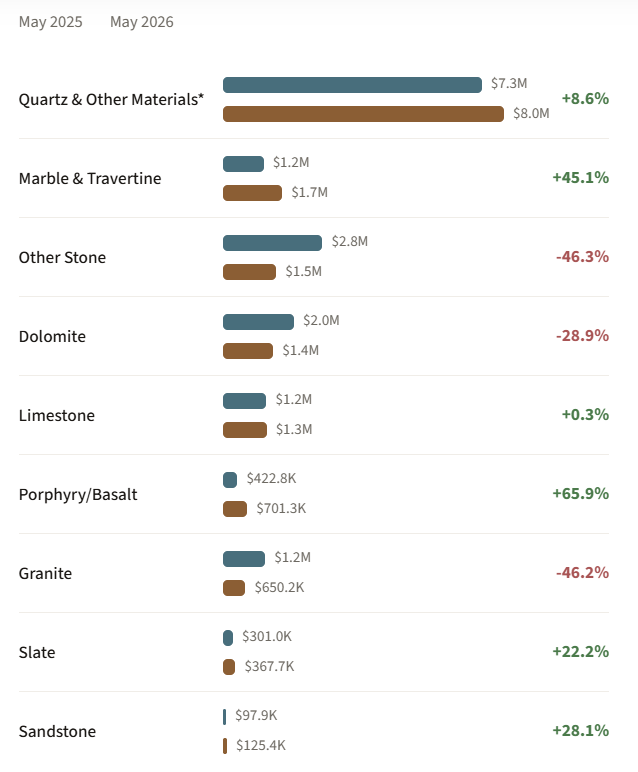
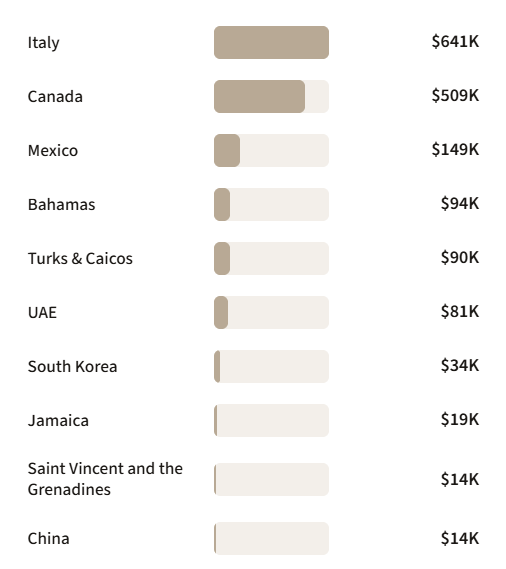
Marble and travertine was the strongest natural stone category, rising 45.1% to $1.7 million. Italy was the top marble destination for a second straight month at $641,000, ahead of Canada at $509,000, a pattern that reflects the re-export of specialty blocks and slabs for finishing abroad.
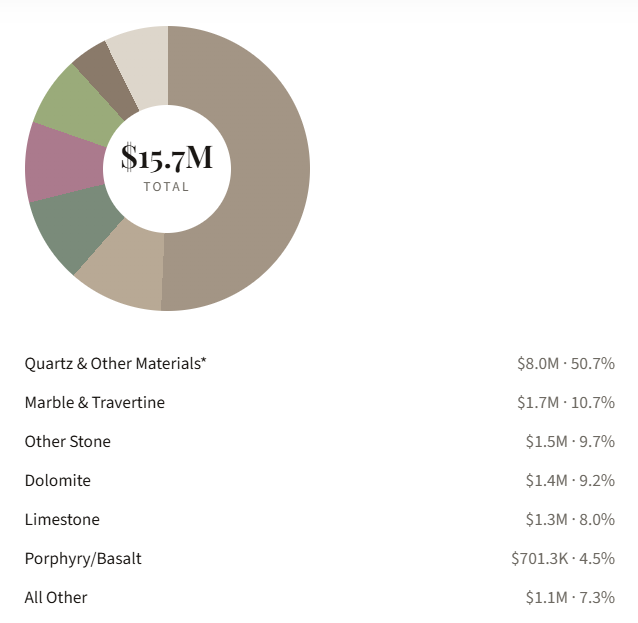
Basalt and porphyry rose 65.9% to $701,000 and slate gained 22.2%, but sharp declines elsewhere pulled the overall figure lower. Granite fell 46.2% to $650,000 and other building stone dropped 46.3% to $1.5 million.
Articles of cement, concrete and artificial stone remained the largest single export category at $8 million, or slightly more than half the monthly total. Because the export classification system does not separate engineered quartz from concrete and cement, the category reflects a mix of all three.
Japan and South Korea each entered the top 10 destinations for the first time this year, at $269,000 and $267,000 respectively.
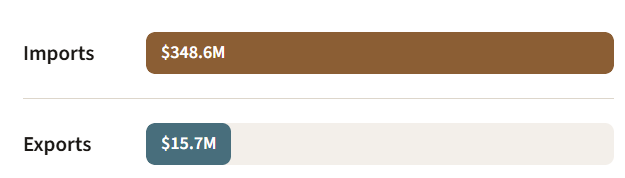
The month’s figures again underscored the scale of the U.S. trade imbalance in stone. The country imported $348.6 million in countertop materials in May while exporting $15.7 million in stone products, a ratio of roughly 22 to 1.


The Trade Imbalance
Imports vs. Exports
Export Categories
Export Products
All Stone Categories
Category Change: May 2025 → May 2026
Destination Countries
What Each Country Receives
Marble Export Destinations
Destination Rankings — Full Breakdown