

Article
GDP (Third Estimate), Industries, Corporate Profits, State GDP, and State Personal Income, 1st Quarter 2026
Friday, July 3, 2026 from BEA:
Real gross domestic product (GDP) increased at an annual rate of 2.1 percent in the first quarter of 2026 (January, February, and March), according to the third estimate released today by the U.S. Bureau of Economic Analysis. In the fourth quarter of 2025, real GDP increased 0.5 percent.
Real GDP was revised up 0.5 percentage point from the second estimate, primarily reflecting a downward revision to imports, which are a subtraction in the calculation of GDP, that was partly offset by a downward revision to consumer spending. For more information, refer to the “Technical Notes” below.
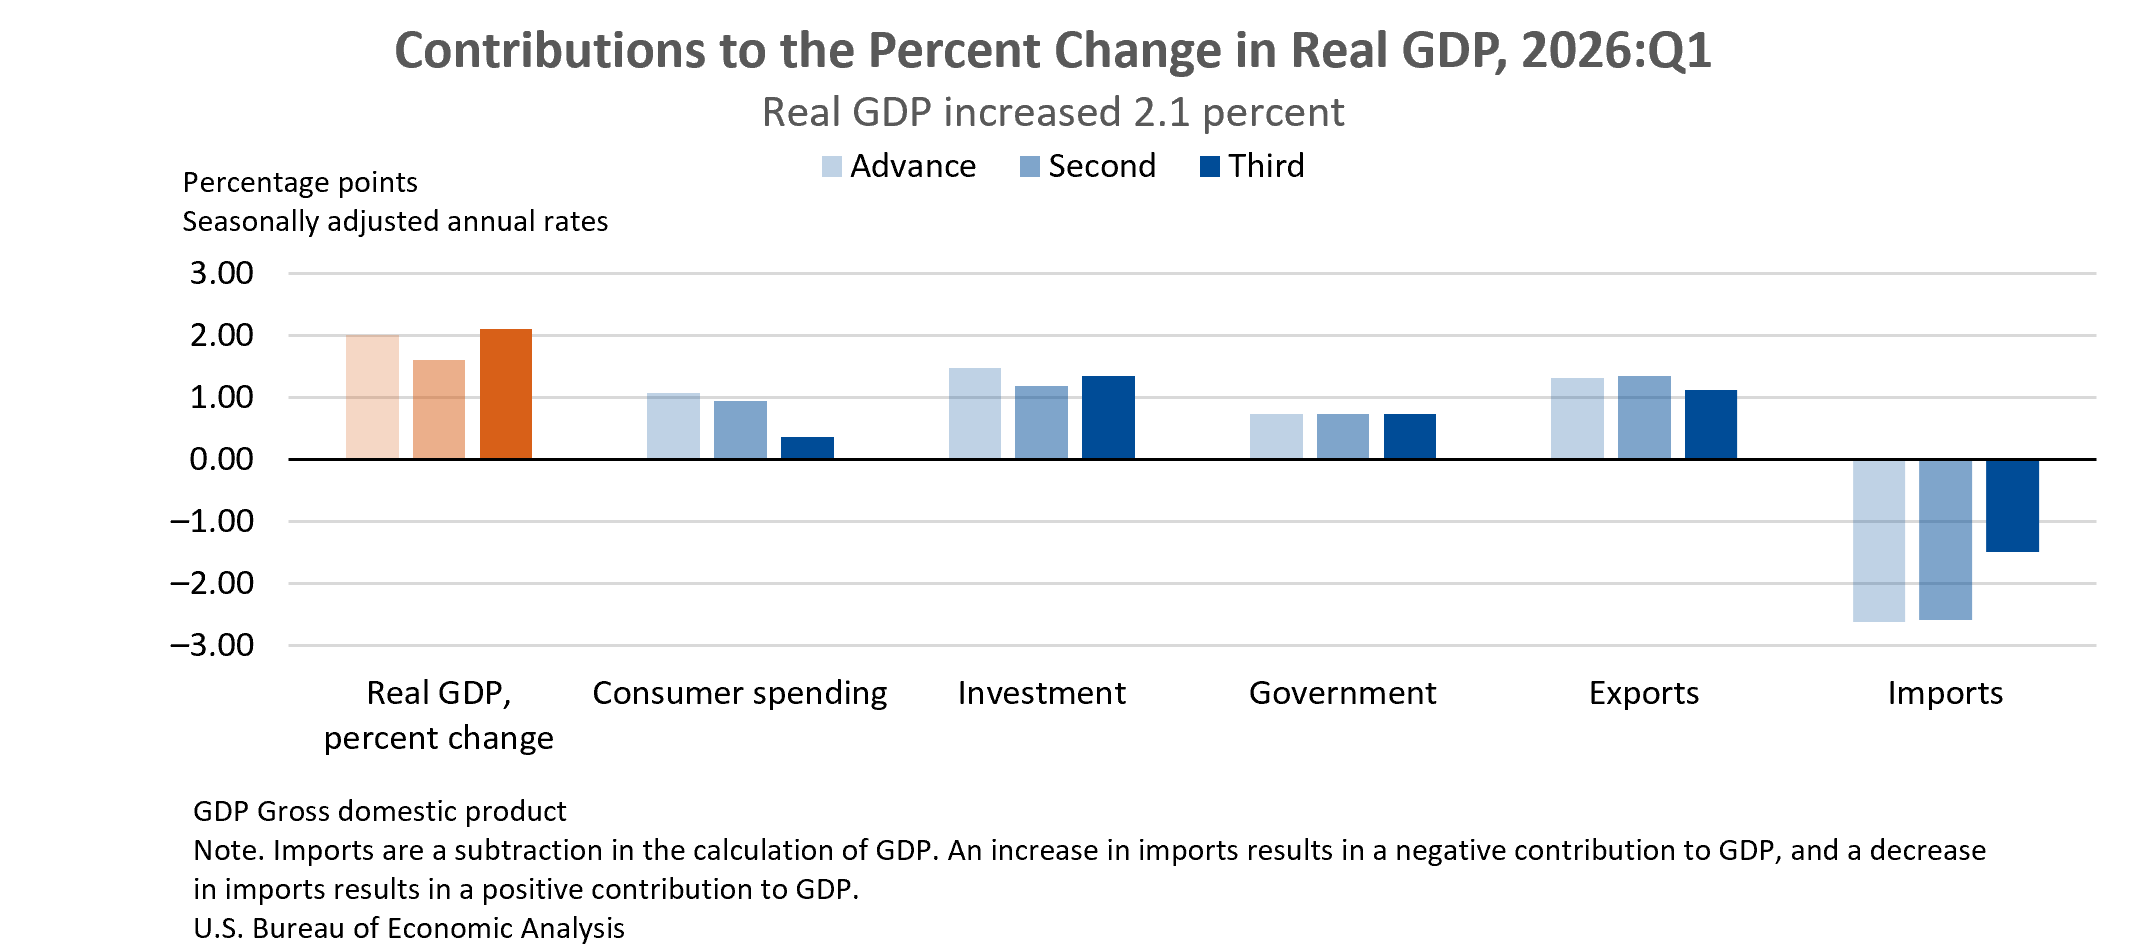
The contributors to the increase in real GDP in the first quarter were investment, exports, government spending, and consumer spending. Imports, which are a subtraction in the calculation of GDP, increased.
GDP by industry
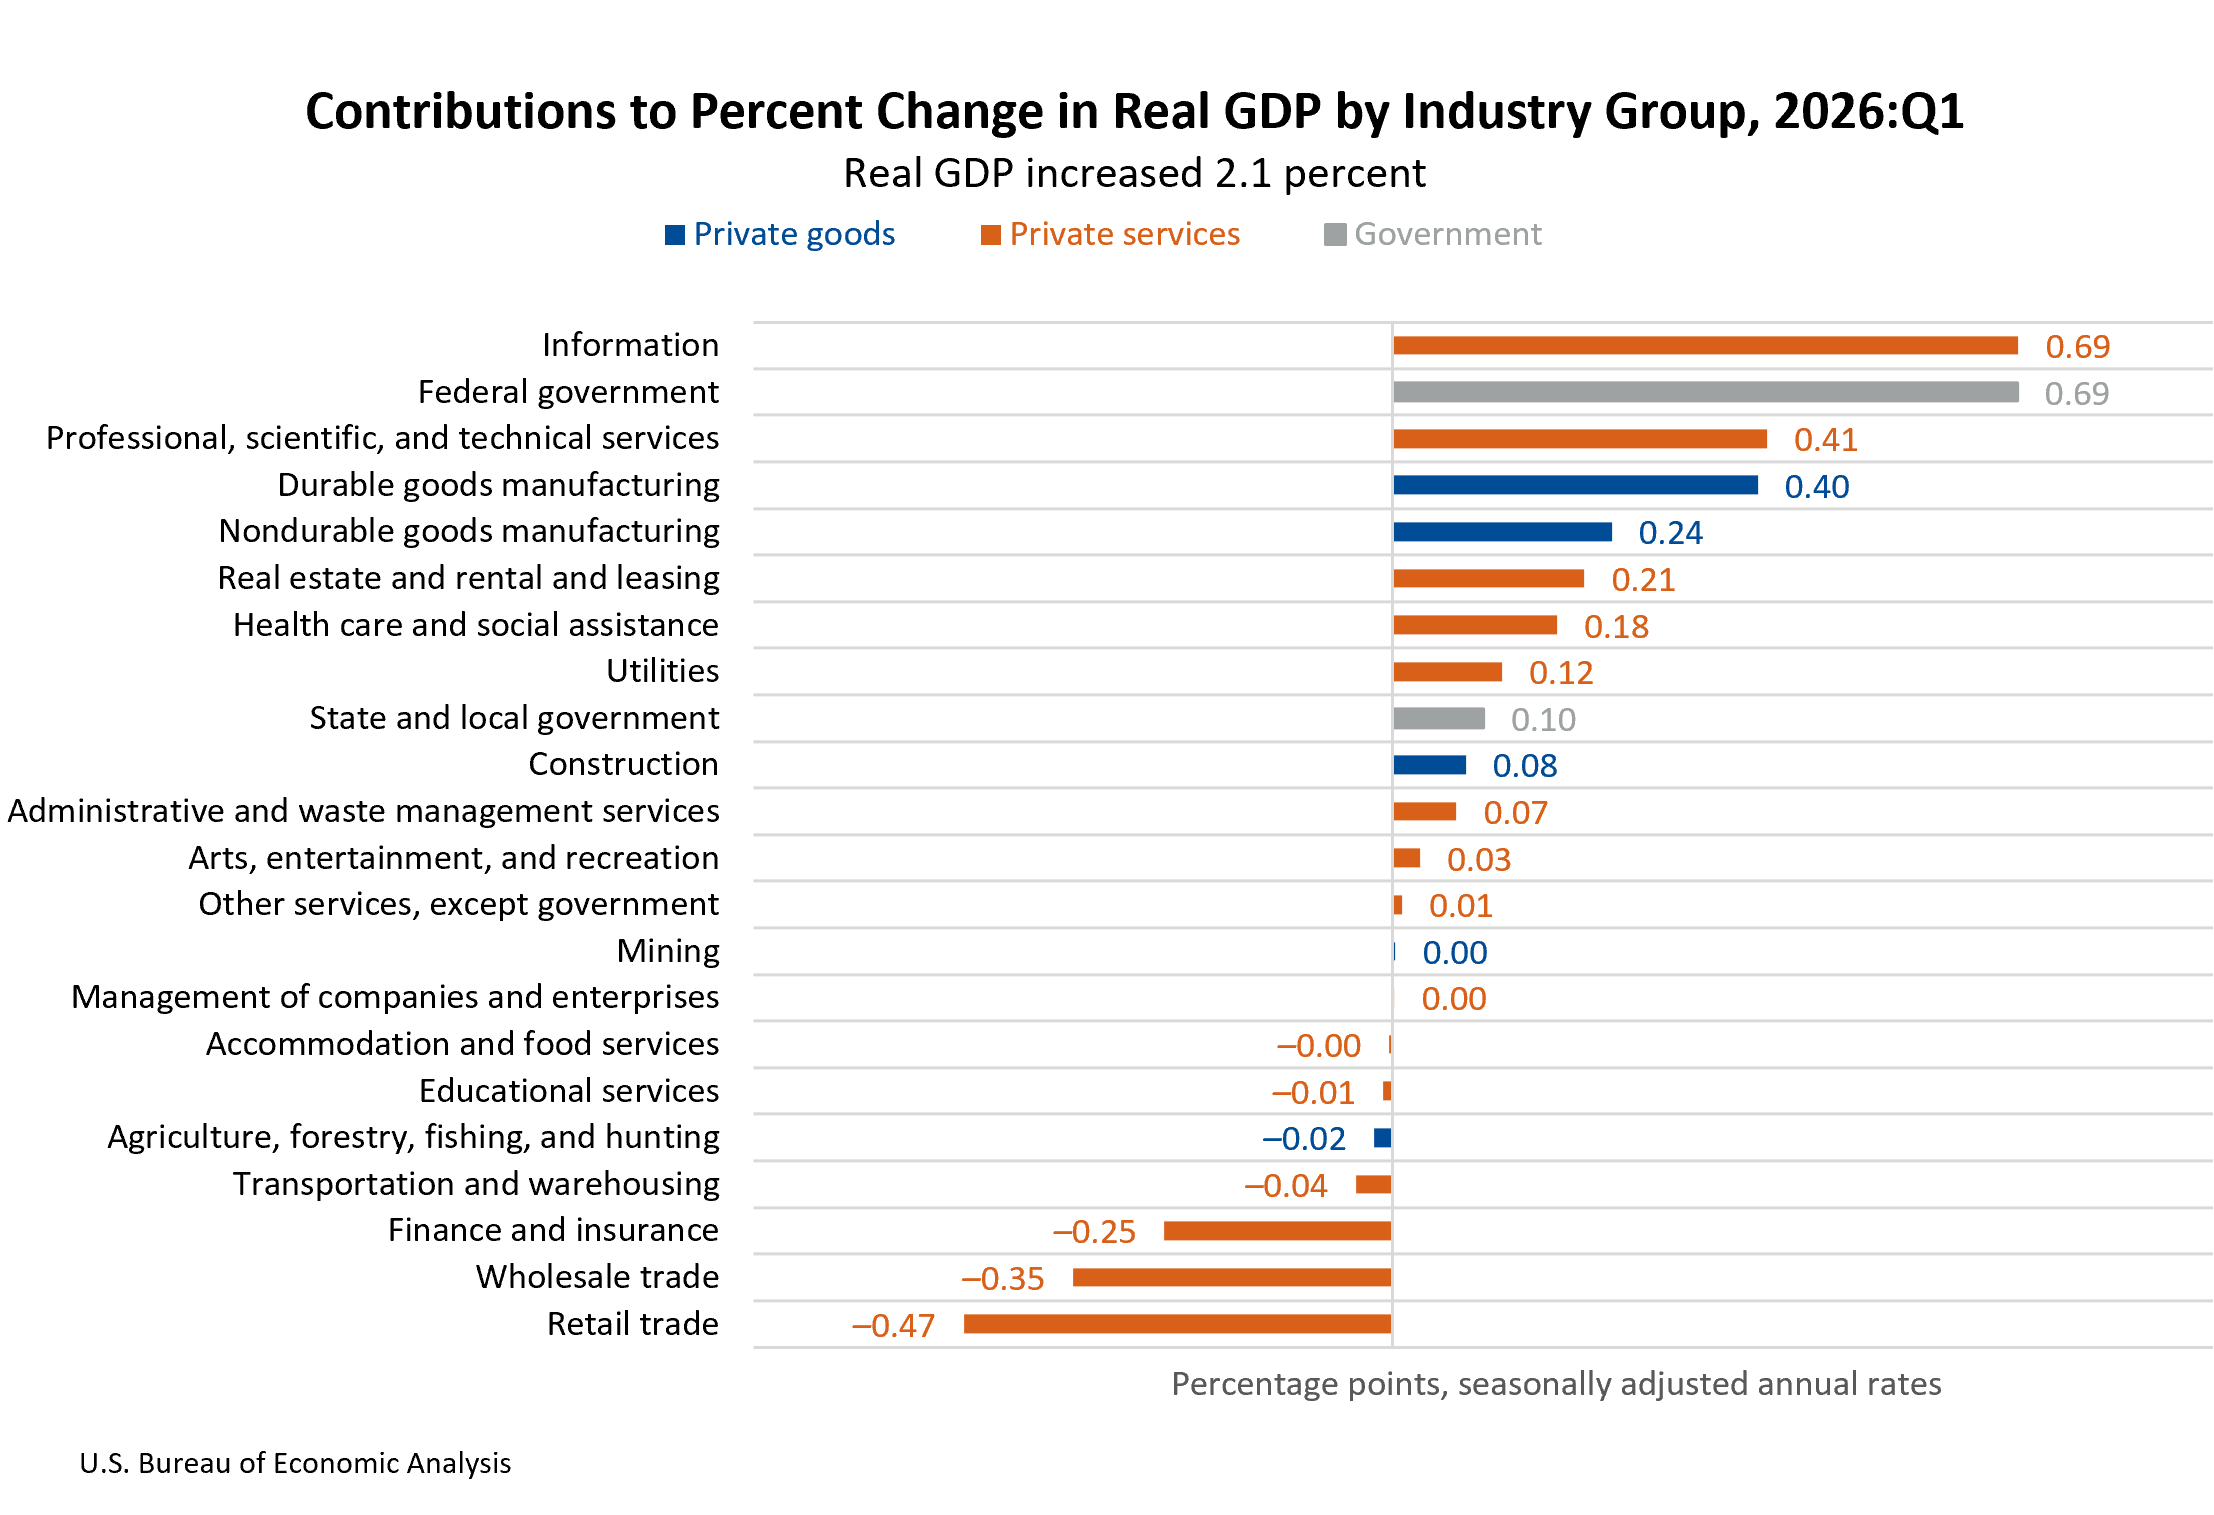
From an industry perspective, the increase in real GDP reflected increases in real value added of 7.5 percent for government, 4.5 percent for private goods-producing industries, and 0.8 percent for private services-producing industries. The leading industry contributors to the increase in real GDP were information; federal government; professional, scientific, and technical services; and durable goods manufacturing. The leading offsets were decreases in retail trade, wholesale trade, and finance and insurance.
Related economic measures
Real final sales to private domestic purchasers, the sum of consumer spending and gross private fixed investment, increased 1.7 percent in the first quarter, revised down 0.7 percentage point from the previous estimate.
Real gross output increased 1.7 percent in the first quarter, reflecting increases of 4.9 percent for government, 1.7 percent for private services-producing industries, and less than 0.1 percent for private goods-producing industries.
Real gross domestic income (GDI) increased 1.2 percent in the first quarter, revised up 0.3 percentage point from the previous estimate. The average of real GDP and real GDI increased 1.7 percent in the first quarter, revised up 0.4 percentage point.
Profits from current production (corporate profits with inventory valuation and capital consumption adjustments) increased $74.4 billion in the first quarter, revised up $34.0 billion.
The price index for gross domestic purchases increased 3.6 percent in the first quarter, revised up 0.1 percentage point from the previous estimate. The personal consumption expenditures (PCE) price index increased 4.6 percent, also revised up 0.1 percentage point, and the PCE price index excluding food and energy increased 4.4 percent, the same as previously estimated.
| Real GDP and Related Measures | ||||
|---|---|---|---|---|
| [Percent change (SAAR) from 2025:Q4 to 2026:Q1] | ||||
| Advance Estimate | Second Estimate | Third Estimate | ||
| Real GDP | 2.0 | 1.6 | 2.1 | |
| Current-dollar GDP | 5.6 | 5.1 | 5.8 | |
| Real final sales to private domestic purchasers | 2.5 | 2.4 | 1.7 | |
| Real GDI | … | 0.9 | 1.2 | |
| Average of real GDP and real GDI | … | 1.3 | 1.7 | |
| Gross domestic purchases price index | 3.6 | 3.5 | 3.6 | |
| PCE price index | 4.5 | 4.5 | 4.6 | |
| PCE price index excluding food and energy | 4.3 | 4.4 | 4.4 | |
| U.S. Bureau of Economic Analysis | ||||
GDP by state
From a regional perspective, real GDP increased in 46 states and the District of Columbia in the first quarter of 2026, with the percent change at an annual rate ranging from 4.5 percent in Washington state to –1.6 percent in South Dakota and remaining unchanged in Delaware.
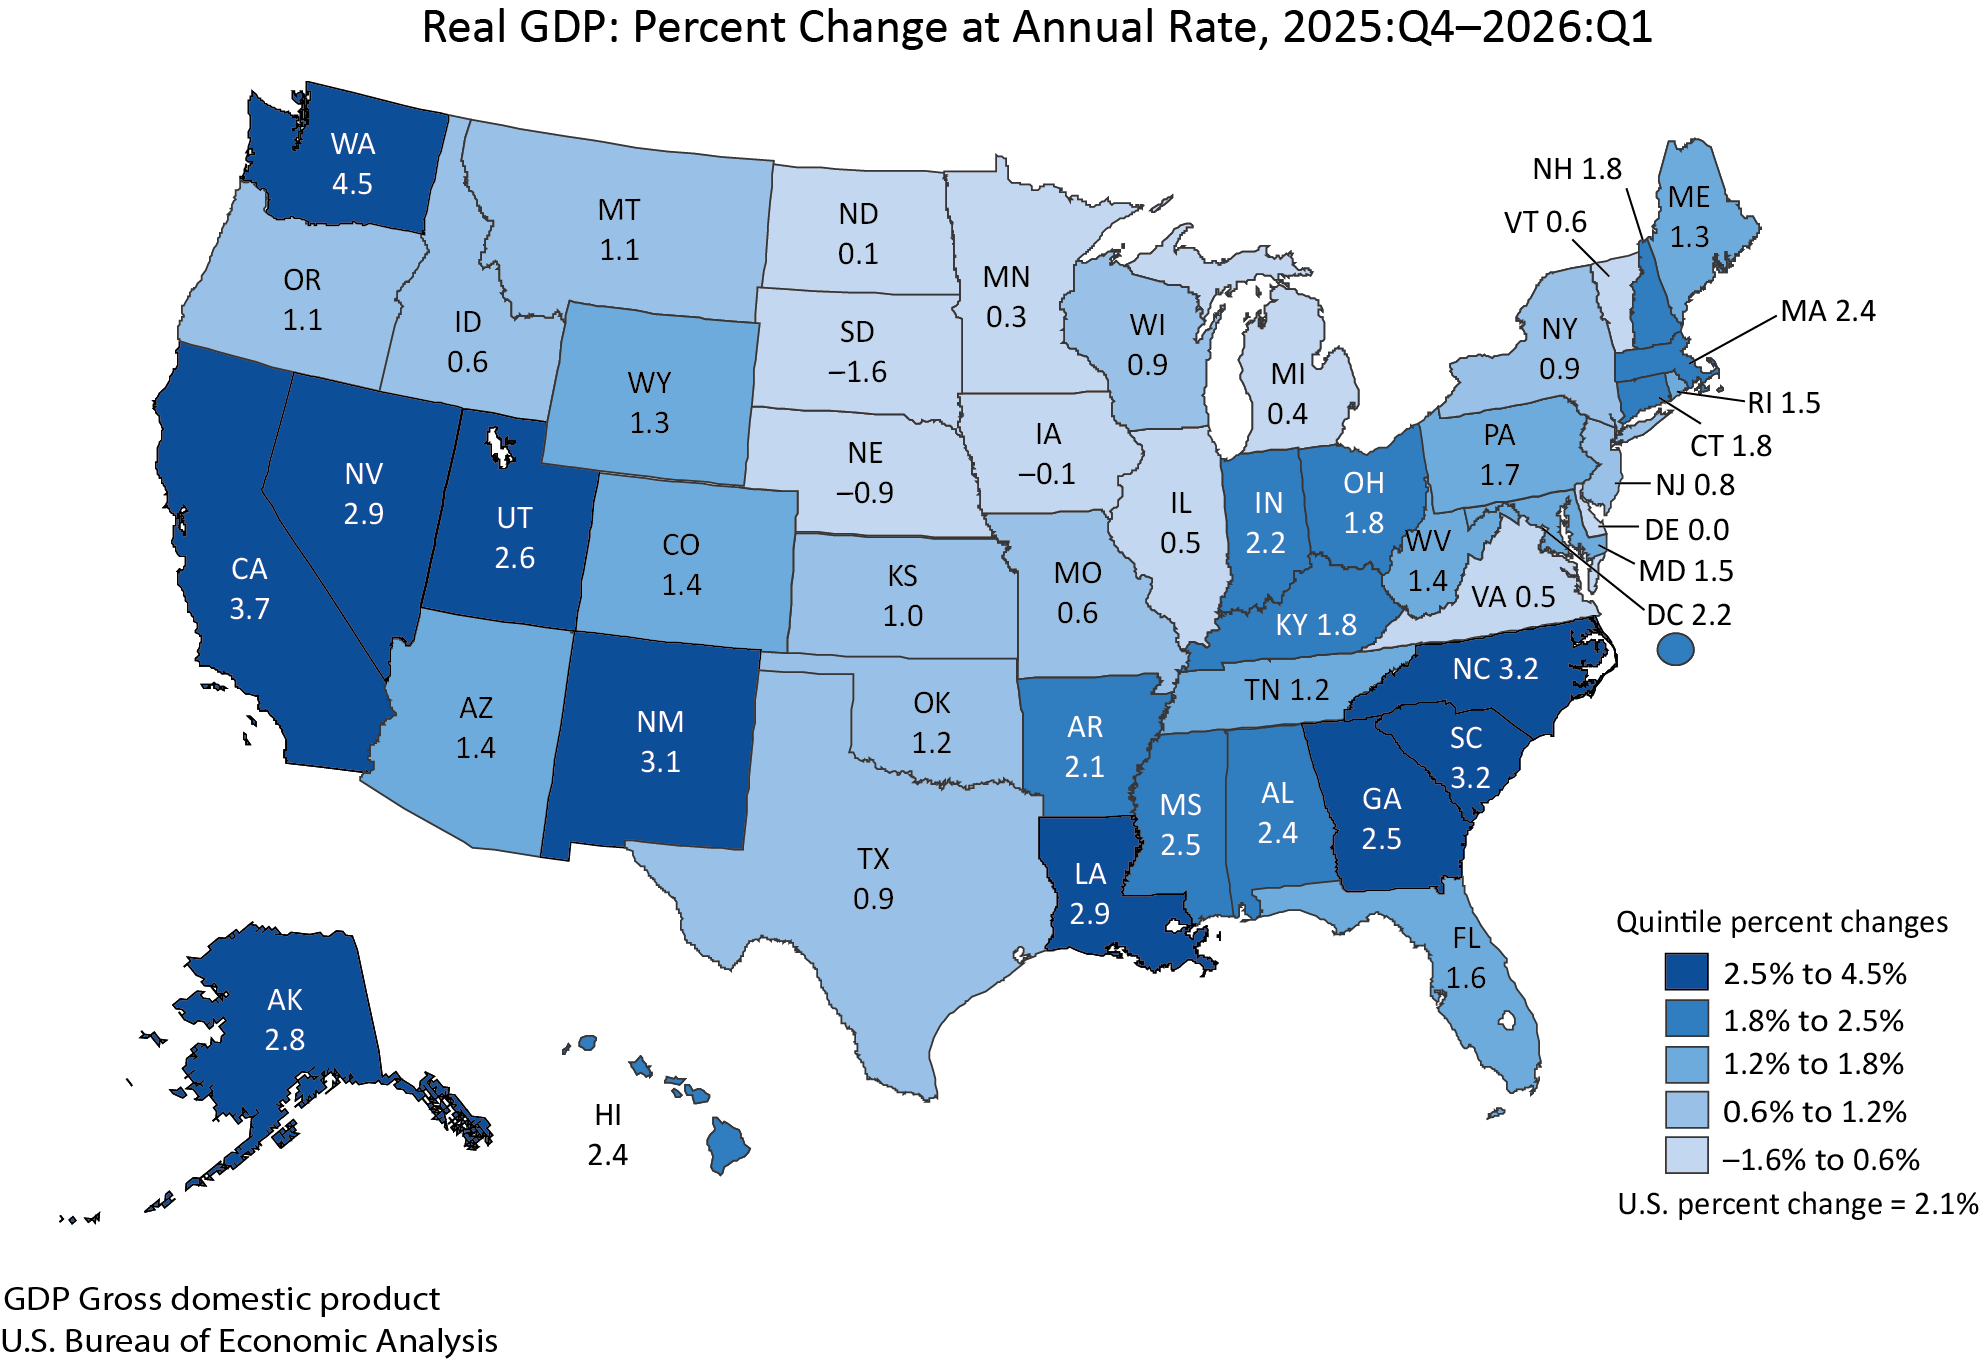
Information was the leading contributor to the increase in real GDP in Washington state. Agriculture, forestry, fishing and hunting was the leading contributor to the decrease in South Dakota.
Personal income by state
In the first quarter of 2026, current-dollar personal income increased $222.6 billion, or 3.4 percent at an annual rate. Personal income increased in 49 states and the District of Columbia, with the percent change at an annual rate in current-dollar personal income ranging from 22.4 percent in North Dakota to –23.9 percent in Hawaii.
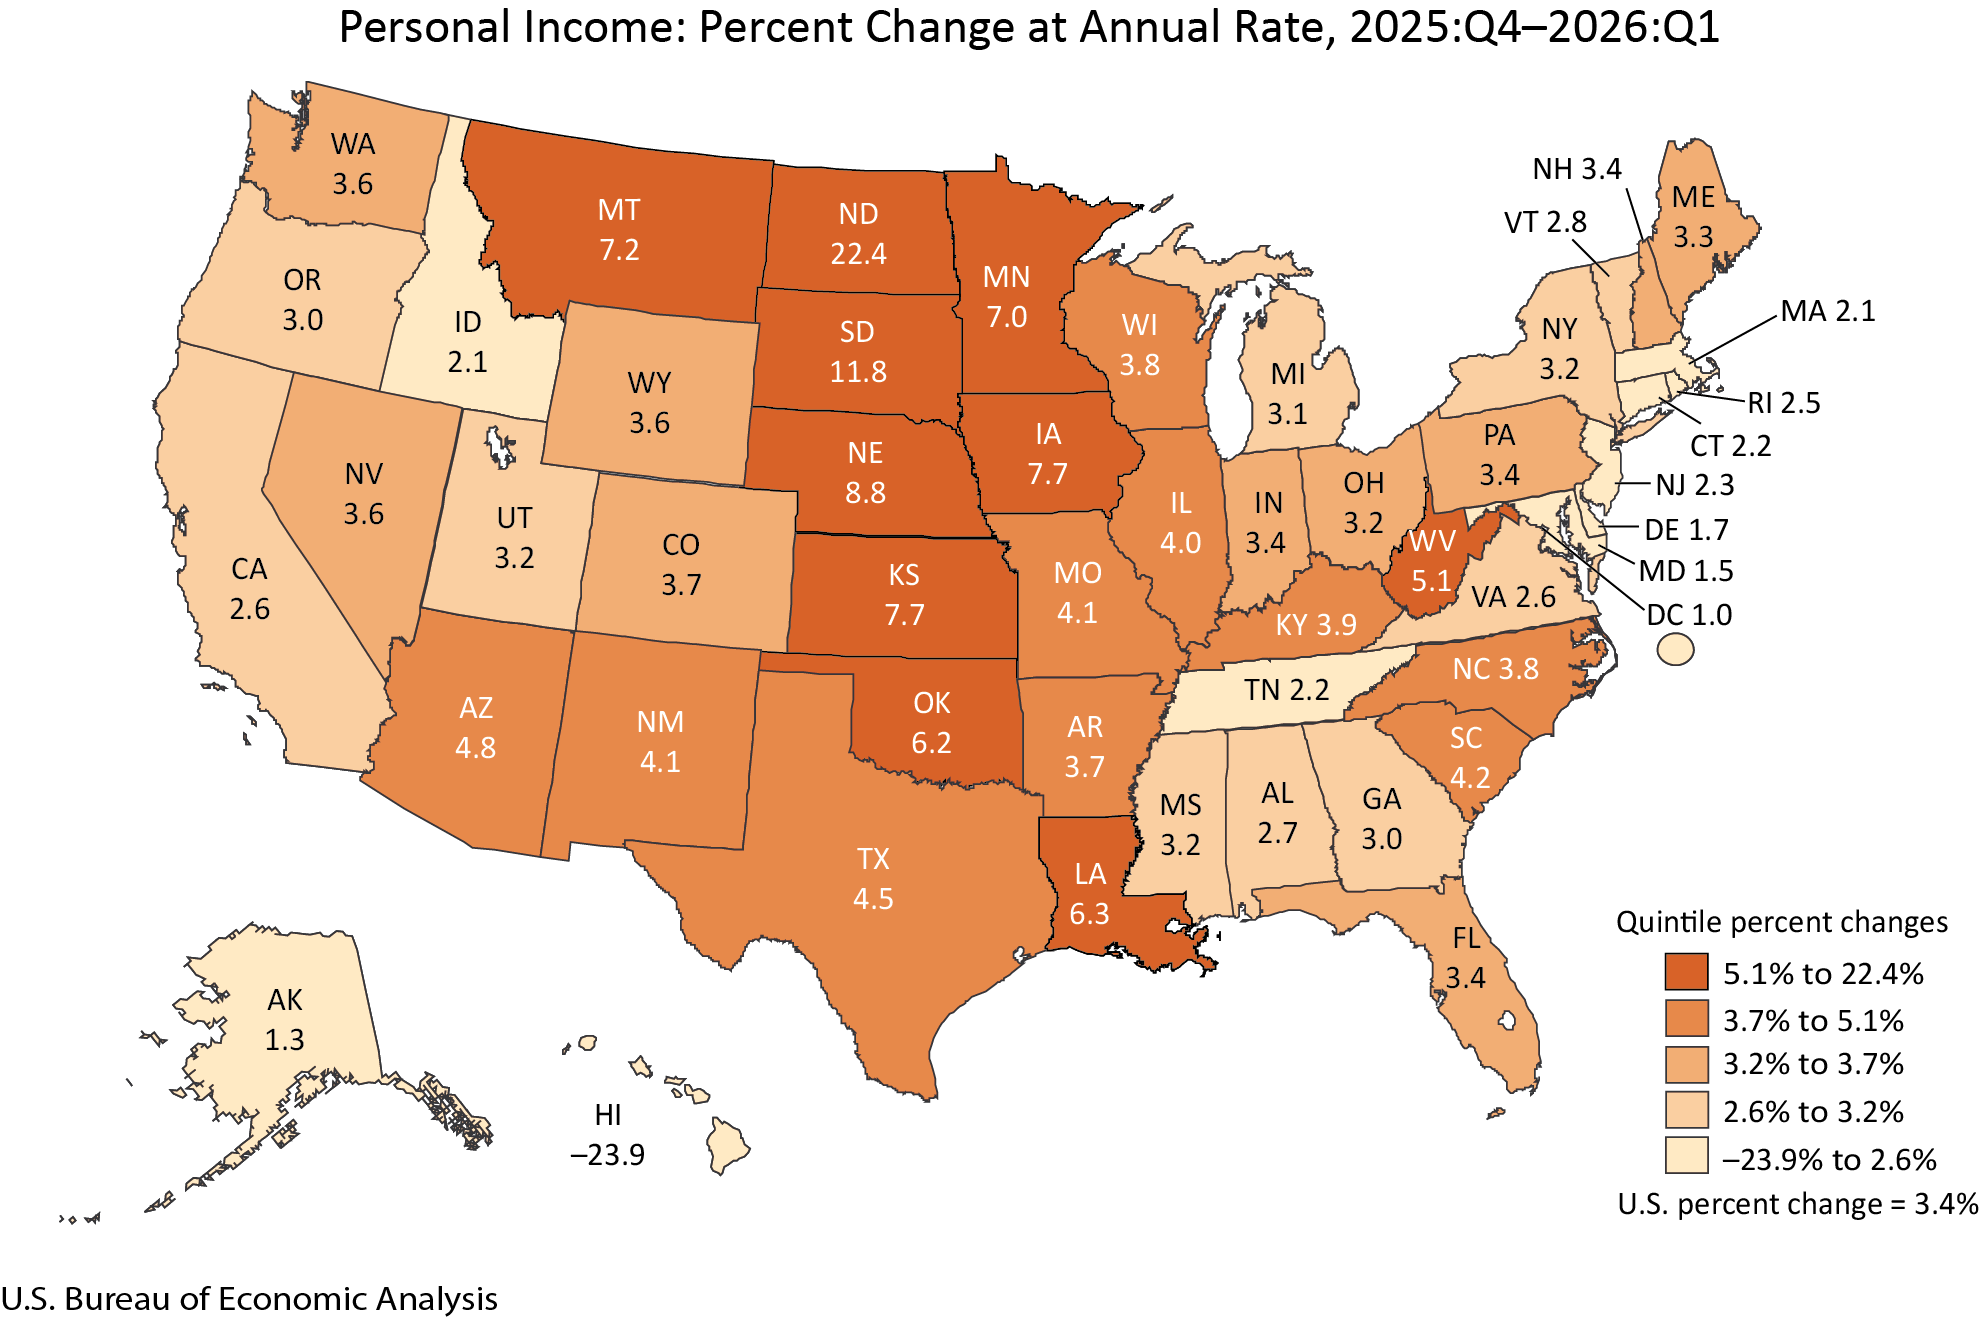
Earnings (compensation plus proprietors’ income) increased in 46 states. The percent change in earnings ranged from 34.7 percent in North Dakota to –1.5 percent in the District of Columbia.
Personal current transfer receipts increased in 45 states and the District of Columbia. The percent change in transfer receipts ranged from 15.5 percent in Minnesota to –75.7 percent in Hawaii. The decrease in transfer receipts in Hawaii reflected a settlement paid to households in the fourth quarter of 2025, related to the 2023 Maui wildfire.
Property income (dividends, interest, and rent) increased in 50 states and the District of Columbia. The percent change ranged from 5.5 percent in Idaho to 3.2 percent in Alaska.
With improvements in concurrent production of BEA statistics, the 2026 annual updates of national, industry, and regional data will begin on the same day for the first time: September 30, 2026. The annual update of the National Economic Accounts (NEAs) includes gross domestic product (GDP), gross domestic income, GDP by industry, monthly personal income and outlays, and related statistics in the National Income and Product Accounts (NIPAs) and the Industry Economic Accounts. The update of the Regional Economic Accounts includes GDP by state and by county, personal income by state and by county, and related statistics. Improvements incorporated as part of the annual updates impact all three sets of accounts. For details, refer to “Information on 2026 Annual Updates to the National, Industry, State, and County Statistics.”
Next release: July 30, 2026, at 8:30 a.m. EDT
GDP (Advance Estimate), 2nd Quarter 2026