
Article
Year-Over-Year Stone Imports 2024 vs. 2025
Wednesday, August 12, 2026 from Stone World

The Year the Decline Picked a Side: U.S. Stone Imports, 2024 vs. 2025
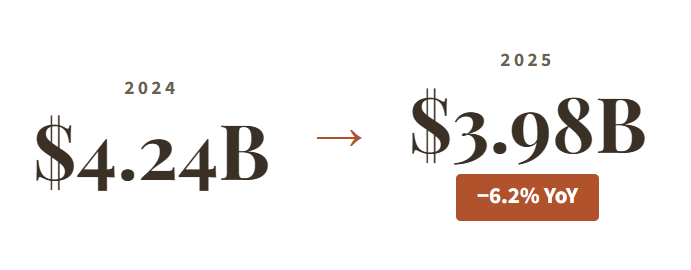
U.S. imports of natural stone and engineered quartz countertop materials fell 6.2% in 2025, but the headline hides the real story. Natural stone held dead flat while engineered quartz dropped 16.5%, quartzite surged 47%, and Brazil overtook India as America’s largest stone supplier.
The Big Picture
Engineered Quartz Drove the Decline. Natural Stone Only Looked Calm.
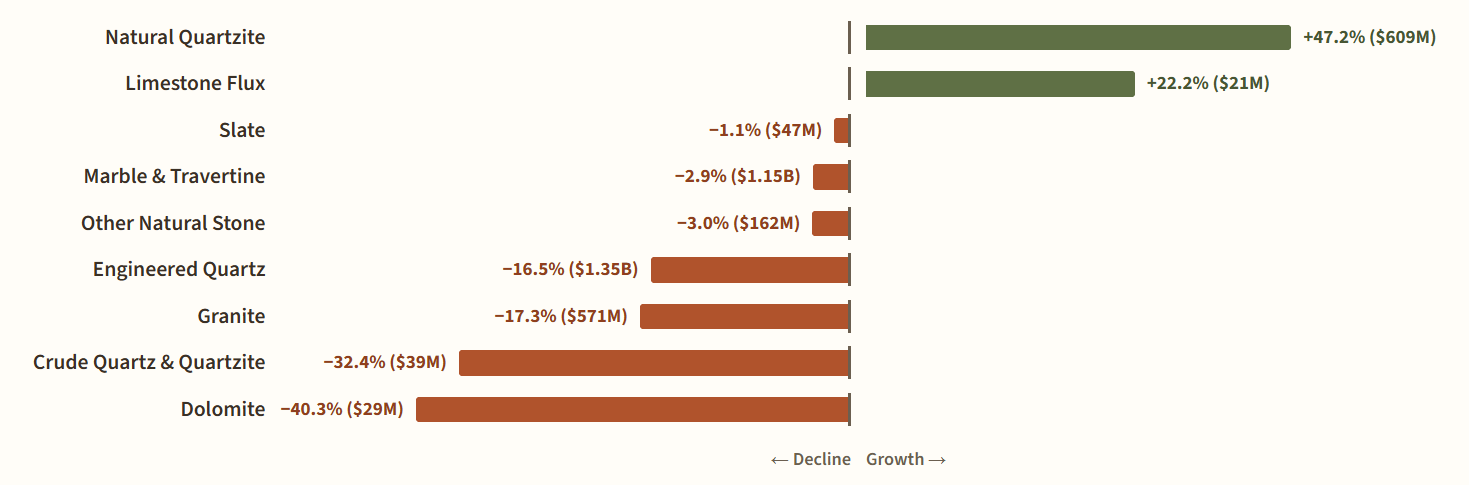
The combined market fell $264 million, and engineered quartz accounts for nearly all of it: the category dropped $265 million to $1.35 billion, the largest dollar decline of any material by a wide margin. Natural stone netted essentially flat at $2.63 billion (+0.03%). But “flat” is doing a lot of work. Beneath the surface, natural quartzite added $195 million while granite gave back $120 million and dolomite fell 40%. The calm top line masks a market sorting hard by material.

Winners and Losers: Change by Material, 2024 to 2025
Year-over-year percent change in customs value. Value in parentheses is the 2025 total.
Sourcing Shift
Brazil Takes the Top Spot
For the first time in this dataset, Brazil ended the year as the No. 1 source country for U.S. stone and quartz imports at $787 million, up 14.6%, leapfrogging India, which fell 13.7% to $690 million. Italy climbed 8.1% to $579 million, holding third. The crossover is no accident: Brazil’s gain is almost entirely a quartzite story, while India’s decline tracks its shrinking engineered quartz volumes.
The Crossover: Top Source Countries, 2024 to 2025
Total customs value by country of origin. Brazil and India highlighted.
Left column shows 2024 value; right column shows 2025 value and year-over-year change. Thin connector lines indicate labels nudged to avoid overlap.
Brazil’s gain is almost entirely a quartzite story; India’s decline tracks its shrinking engineered quartz volumes.
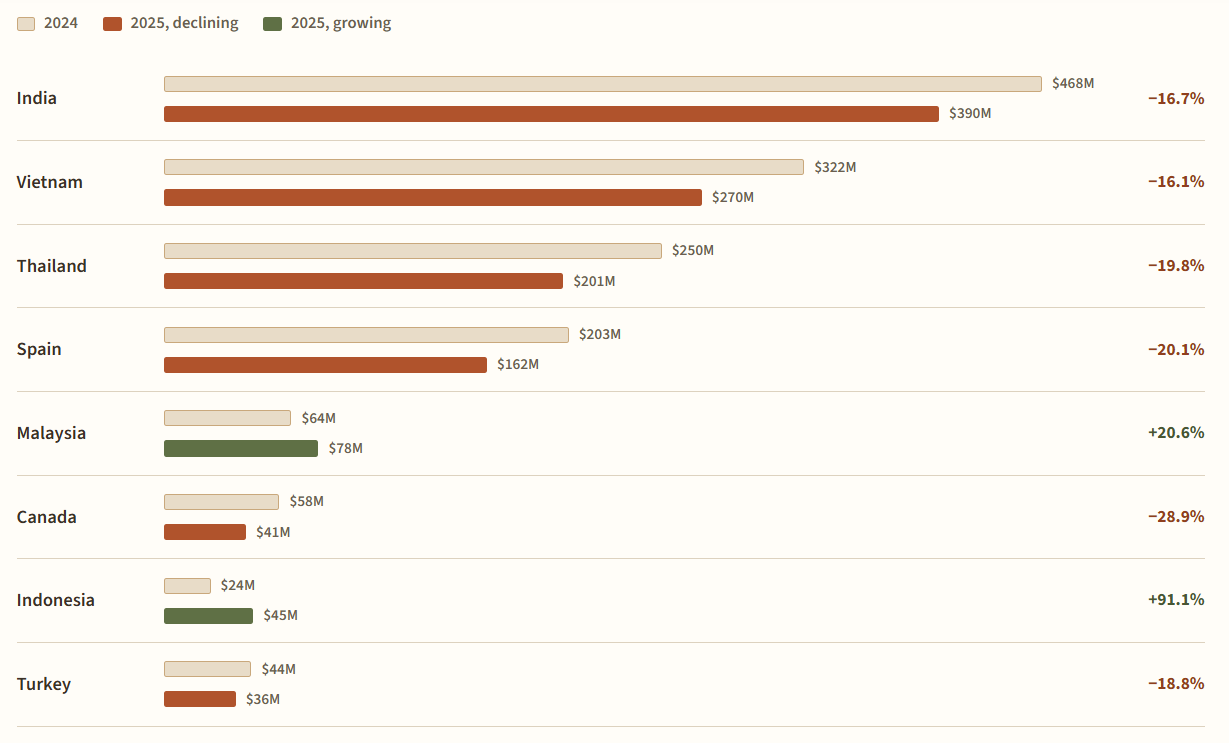
Further down the table, the moves were sharper. China’s slide continued, down 32.2% to $241 million. Thailand (−19.3%), Canada (−19.8%), Spain (−18.4%) and Vietnam (−12.1%) all gave ground. The growth came from newer players: Indonesia jumped 66.2% to $53 million and Malaysia rose 26.5% to $82 million, both riding engineered quartz capacity that continues to migrate across Southeast Asia.
Engineered Quartz
A Broad-Based Retreat, With Two Exceptions
The 16.5% decline in engineered quartz was not a one country event. Every major established source fell by double digits: India −16.7%, Vietnam −16.1%, Thailand −19.8%, Spain −20.1%. When a decline is that uniform across origins, it points to demand, a soft remodeling market and slower slab turns, rather than trade reshuffling alone. The exceptions were Malaysia (+20.6%) and Indonesia, which nearly doubled (+91.1%) to $45 million.
Material Spotlight
Quartzite’s Breakout Year
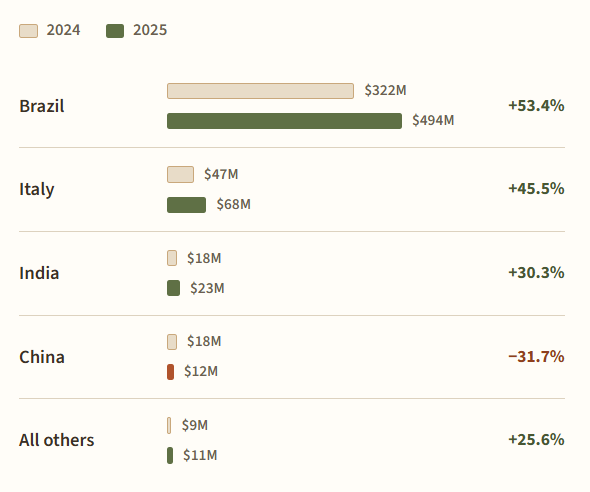
Natural quartzite was the standout performer of 2025, surging 47.2% to $609 million, and climbing from 15.7% to 23.1% of all natural stone imports in a single year. Brazil supplied $494 million of it, up 53.4%, accounting for roughly 81 cents of every quartzite dollar. Italy’s quartzite shipments grew 45.5% to $68 million. As the engineered stone category navigates regulatory scrutiny and silicosis litigation, the import data suggests fabricators and designers are increasingly reaching for the natural alternative that delivers a similar look.
Where Quartzite Comes From
Top sources by customs value
Granite told the opposite story, falling 17.3% to $571 million, the steepest decline among major natural categories. Marble and travertine held up far better, easing just 2.9% to $1.15 billion and remaining the largest natural stone category.
The Shape of the Year
A Tale of Two Halves
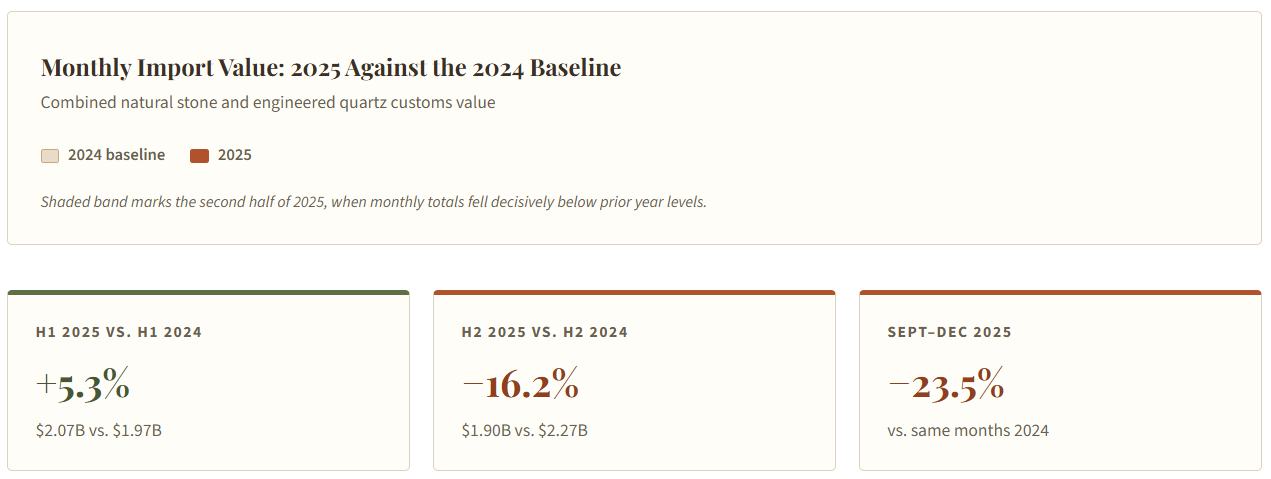
The annual numbers obscure how dramatically 2025 turned. Through June, imports actually ran 5.3% ahead of 2024, consistent with importers front loading inventory ahead of new tariff actions. Then the second half fell 16.2% below the prior year, and the final four months were off 23.5%. November marked the year’s low point at $267 million, and December, at $306 million, still ran 20% below its 2024 level. Whatever 2026 holds, it begins from a sharply lower run rate than the annual total implies.