
Article
U.S. Stone Exports: February 2026 Report
Wednesday, May 20, 2026 from Stone World
U.S. stone exports totaled $11.2 million in February 2026, a 14.2% decline from $13.1 million in February 2025.
By Jason Kamery

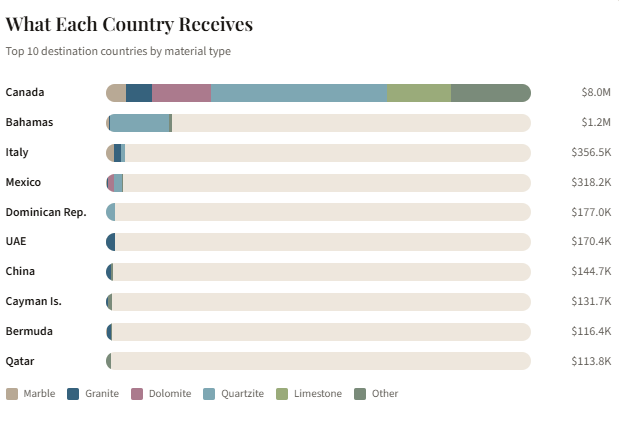
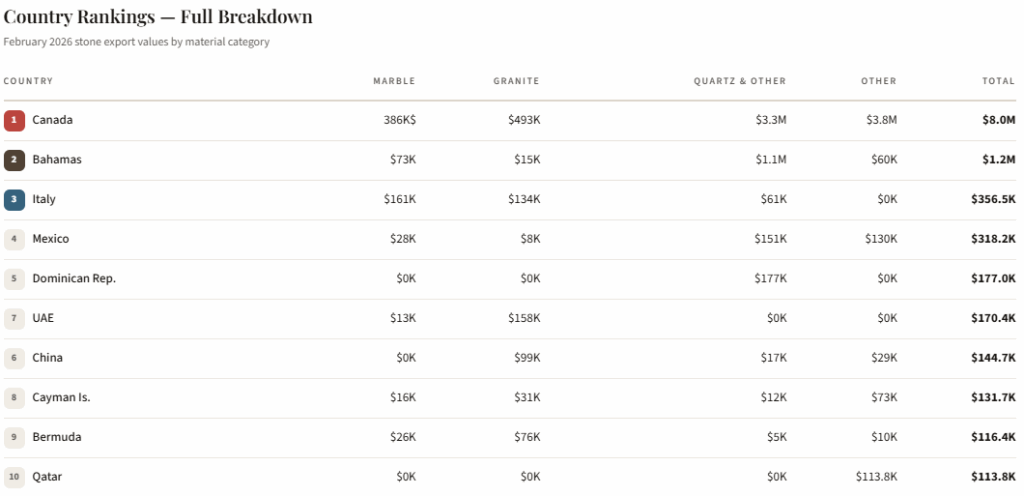
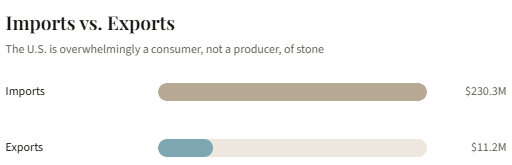
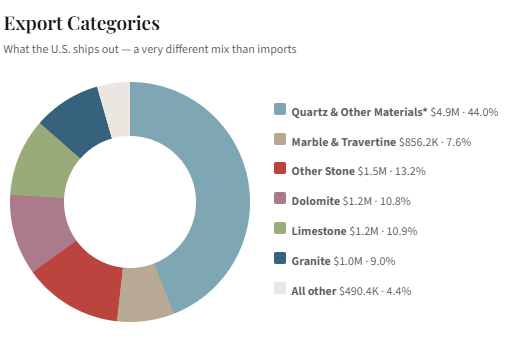
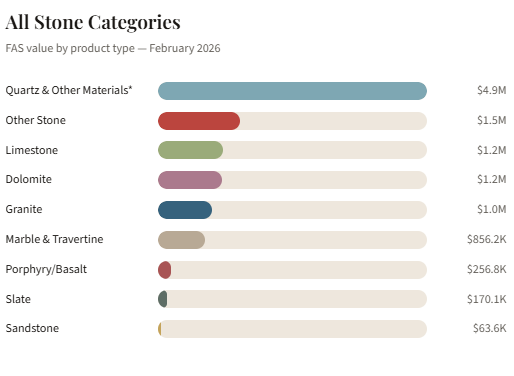
U.S. stone exports totaled $11.2 million in February 2026, a 14.2% decline from $13.1 million in February 2025. While the drop continued a downward trend, exports proved far more resilient than imports, which fell 29.2% over the same period. The result was a narrowing of the U.S. stone trade imbalance, though it remained vast at 21 to 1, with the country importing $230.3 million in countertop materials against the $11.2 million it shipped out. Canada remained the dominant destination by a wide margin, receiving nearly $8 million in stone products, or roughly 71% of all U.S. exports. The Quartz and Other Materials category led all product types at $4.9 million, followed at a distance by Other Stone at $1.5 million, limestone at $1.2 million and dolomite at $1.2 million.
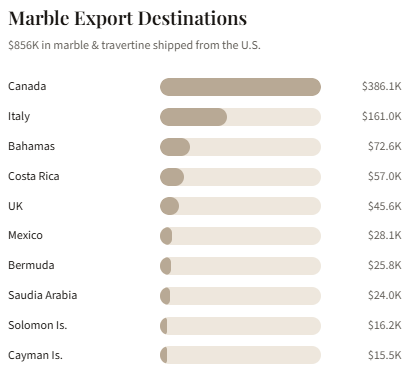
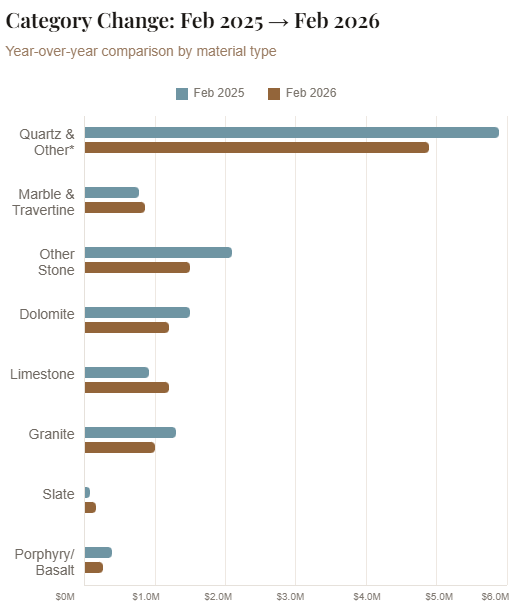
The category picture was mixed rather than uniformly negative. Marble and travertine exports rose 10.4% year over year to $856,000, and limestone and slate also posted gains, while granite fell 22.5% and the Quartz and Other Materials category declined 16.1%. The destination data showed the same tariff-driven volatility visible on the import side. Exports to the Bahamas surged to $1.2 million, more than tripling from a year earlier and pushing the country into the second destination spot, while shipments to China fell roughly 80% and exports to the United Arab Emirates dropped about 70%. The figures reinforce the regional and concentrated nature of U.S. stone exports, with Canada, the Bahamas and a cluster of Caribbean and Gulf destinations accounting for the overwhelming majority of outbound shipments.

The Trade Imbalance
Export Products
Destination Countries