

Article
U.S. International Trade in Goods and Services, February 2026
Thursday, April 2, 2026 from BEA
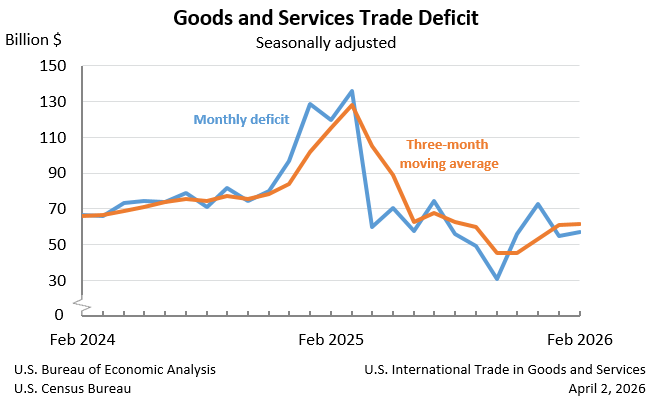
The U.S. Census Bureau and the U.S. Bureau of Economic Analysis announced today that the goods and services deficit was $57.3 billion in February, up $2.7 billion from $54.7 billion in January, revised.
| Deficit: | $57.3 Billion | +4.9%° |
| Exports: | $314.8 Billion | +4.2%° |
| Imports: | $372.1 Billion | +4.3%° |
| Next release: Tuesday, May 5, 2026
(°) Statistical significance is not applicable or not measurable. Data adjusted for seasonality but not price changes Source: U.S. Census Bureau, U.S. Bureau of Economic Analysis; U.S. International Trade in Goods and Services, April 2, 2026 |
||
Exports, Imports, and Balance (exhibit 1)
February exports were $314.8 billion, $12.6 billion more than January exports. February imports were $372.1 billion, $15.2 billion more than January imports.
The February increase in the goods and services deficit reflected an increase in the goods deficit of $2.5 billion to $84.6 billion and a decrease in the services surplus of $0.2 billion to $27.3 billion.
Year-to-date, the goods and services deficit decreased $136.1 billion, or 54.8 percent, from the same period in 2025. Exports increased $62.6 billion or 11.3 percent. Imports decreased $73.5 billion or 9.2 percent.
Three-Month Moving Averages (exhibit 2)
The average goods and services deficit increased $0.4 billion to $61.6 billion for the three months ending in February.
- Average exports increased $8.0 billion to $301.1 billion in February.
- Average imports increased $8.4 billion to $362.7 billion in February.
Year-over-year, the average goods and services deficit decreased $53.4 billion from the three months ending in February 2025.
- Average exports increased $26.2 billion from February 2025.
- Average imports decreased $27.1 billion from February 2025.
Exports (exhibits 3, 6, and 7)
Exports of goods increased $11.5 billion to $206.9 billion in February.
Exports of goods on a Census basis increased $11.5 billion.
- Industrial supplies and materials increased $10.2 billion.
- Nonmonetary gold increased $8.0 billion.
- Natural gas increased $1.3 billion.
Net balance of payments adjustments increased less than $0.1 billion.
Exports of services increased $1.1 billion to $107.9 billion in February.
- Travel increased $0.3 billion.
- Other business services increased $0.2 billion.
- Financial services increased $0.2 billion.
- Charges for the use of intellectual property increased $0.2 billion.
- Transport decreased $0.2 billion.
Imports (exhibits 4, 6, and 8)
Imports of goods increased $14.0 billion to $291.5 billion in February.
Imports of goods on a Census basis increased $14.1 billion.
- Capital goods increased $7.8 billion.
- Computers increased $5.4 billion.
- Computer accessories increased $1.5 billion.
- Semiconductors increased $1.1 billion.
- Industrial supplies and materials increased $3.1 billion.
- Crude oil increased $1.1 billion.
- Consumer goods increased $2.2 billion.
- Pharmaceutical preparations increased $1.0 billion.
- Automotive vehicles, parts, and engines increased $1.6 billion.
- Trucks, buses, and special purpose vehicles increased $1.1 billion.
Net balance of payments adjustments decreased $0.1 billion.
Imports of services increased $1.3 billion to $80.6 billion in February.
- Charges for the use of intellectual property increased $1.0 billion.
Real Goods in 2017 Dollars – Census Basis (exhibit 11)
The real goods deficit increased $0.5 billion, or 0.6 percent, to $83.5 billion in February, compared to a 3.2 percent increase in the nominal deficit.
- Real exports of goods increased $7.1 billion, or 4.6 percent, to $161.9 billion, compared to a 5.9 percent increase in nominal exports.
- Real imports of goods increased $7.6 billion, or 3.2 percent, to $245.5 billion, compared to a 5.1 percent increase in nominal imports.
Revisions
Revisions to January exports
- Exports of goods were revised down $0.1 billion.
- Exports of services were revised up $0.2 billion.
Revisions to January imports
- Imports of goods were revised up $0.3 billion.
- Imports of services were revised up less than $0.1 billion.
Goods by Selected Countries and Areas: Monthly – Census Basis (exhibit 19)
The February figures show surpluses, in billions of dollars, with Switzerland ($7.8), Netherlands ($6.8), Hong Kong ($6.6), United Kingdom ($5.6), South and Central America ($3.8), Singapore ($2.9), Brazil ($1.4), Australia ($0.9), Belgium ($0.8), and Saudi Arabia ($0.2). Deficits were recorded, in billions of dollars, with Taiwan ($21.1), Mexico ($16.8), Vietnam ($16.5), China ($13.1), South Korea ($7.6), European Union ($5.1), Japan ($4.7), Malaysia ($4.0), India ($3.5), Germany ($3.3), Ireland ($2.8), France ($2.2), Italy ($1.8), Israel ($0.8), and Canada ($0.7).
- The deficit with Mexico increased $4.1 billion to $16.8 billion in February. Exports decreased $1.7 billion to $31.2 billion and imports increased $2.4 billion to $48.0 billion.
- The deficit with Taiwan increased $3.8 billion to $21.1 billion in February. Exports decreased $0.8 billion to $4.6 billion and imports increased $3.0 billion to $25.7 billion.
- The surplus with Switzerland increased $4.8 billion to $7.8 billion in February. Exports increased $5.9 billion to $12.1 billion and imports increased $1.1 billion to $4.3 billion.
All statistics referenced are seasonally adjusted; statistics are on a balance of payments basis unless otherwise specified. Additional statistics, including not seasonally adjusted statistics and details for goods on a Census basis, are available in exhibits 1-20b of this release. For information on data sources, definitions, and revision procedures, see the explanatory notes in this release. The full release can be found at www.census.gov/foreign-trade/Press-Release/current_press_release/index.html or www.bea.gov/data/intl-trade-investment/international-trade-goods-and-services. The full schedule is available in the Census Bureau’s Economic Briefing Room at www.census.gov/economic-indicators/ or on BEA’s website at www.bea.gov/news/schedule.
Next release: May 5, 2026
U.S. International Trade in Goods and Services, March 2026