Article
U.S. Countertop Materials Imports: May 2026
Tuesday, August 11, 2026 from Stone World
By Jason Kamery

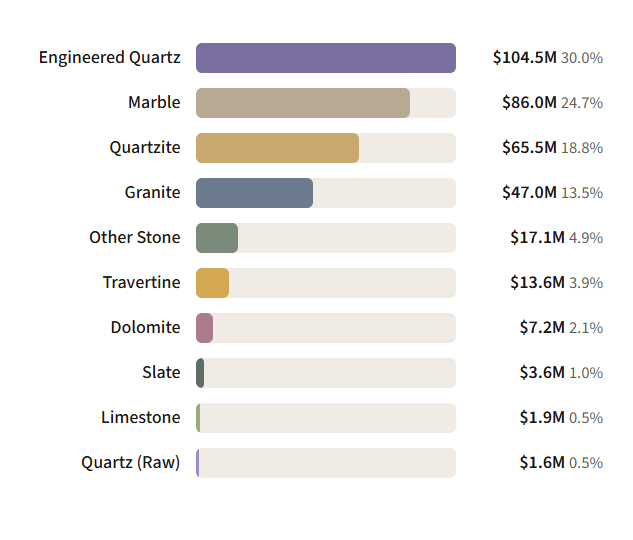
U.S. countertop material imports held roughly flat in May at $348.6 million, down 0.7% from May 2025, but the mix behind that steady topline kept rotating toward natural stone.
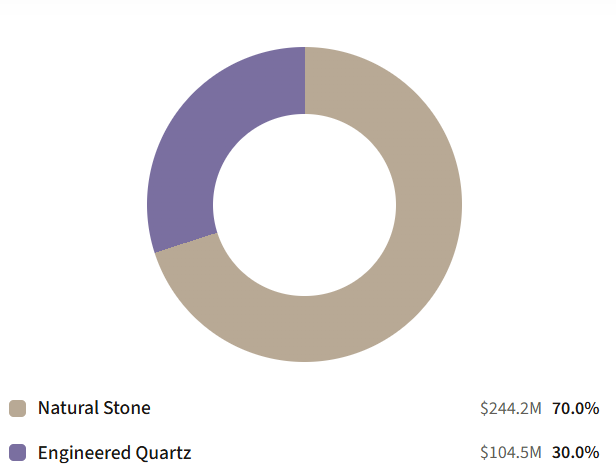
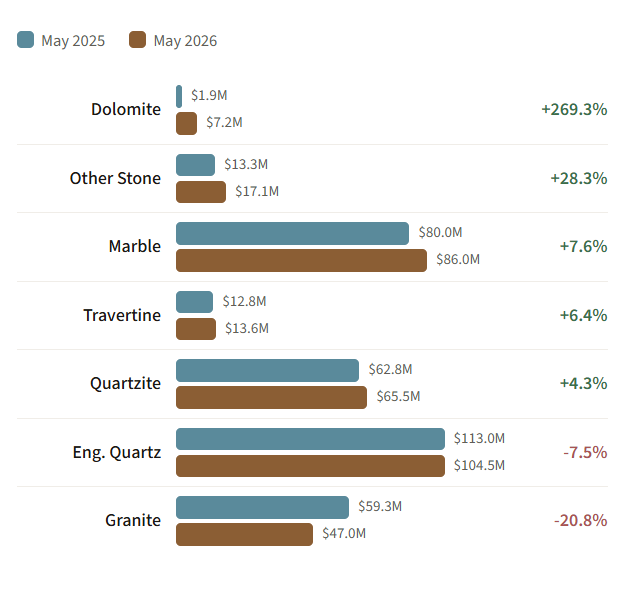
Natural stone accounted for 70% of the month’s total at $244.2 million, up 2.6% year over year and its highest share of any month in 2026. Engineered quartz fell 7.5% to $104.5 million, with its share slipping to 30% from 32.2% a year earlier.
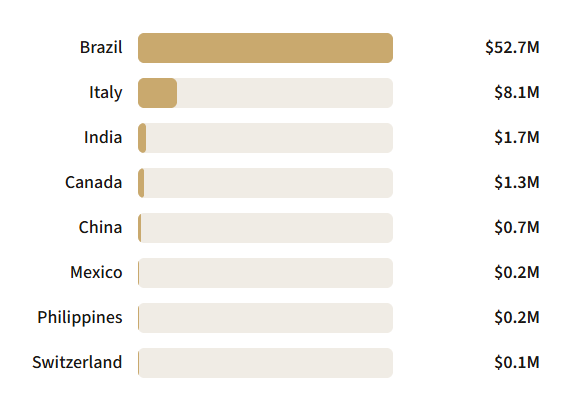
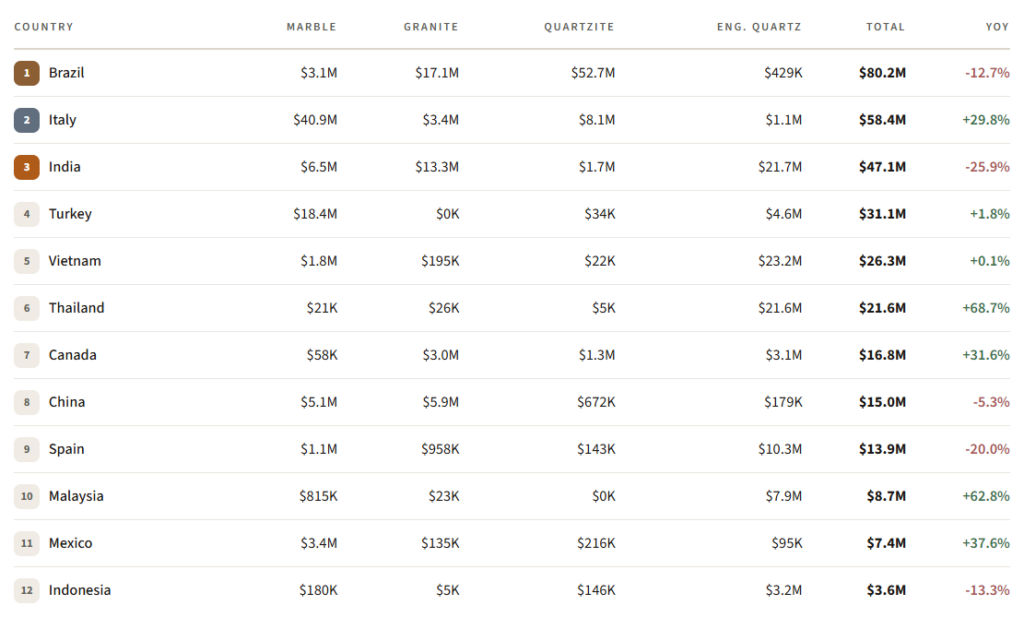
Quartzite was the standout. Imports reached $65.5 million, up 4.3% and roughly half again the size of granite. Brazil supplied $52.7 million of that, and Italian quartzite rose 51% to $8.1 million.
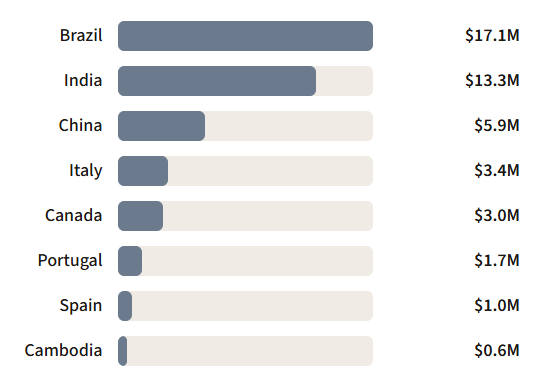
Granite went the other way, falling 20.8% to $47 million and posting the steepest decline of any major category. Brazil dropped 30% to $17.1 million but reclaimed the top spot from India, which had led granite imports every month from January through April. Italy fell 35% and Canada 33%. Portugal, Cambodia and China were the only sources to grow.
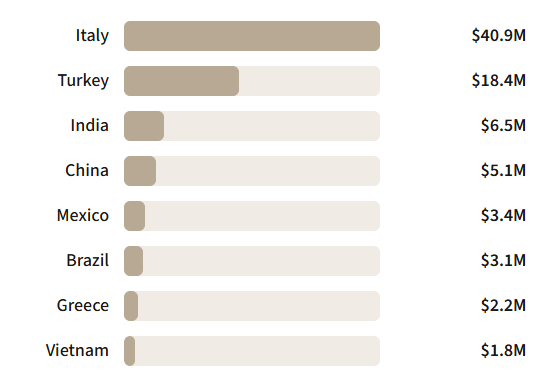
Marble rose 7.6% to $86 million on the strength of a single country. Italian marble climbed to $40.9 million, an increase of $11.6 million that more than covered the category’s $6 million gain. Turkey slipped 11% and China fell 26%.
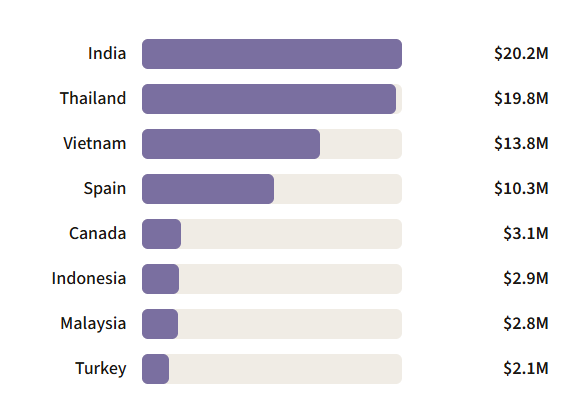
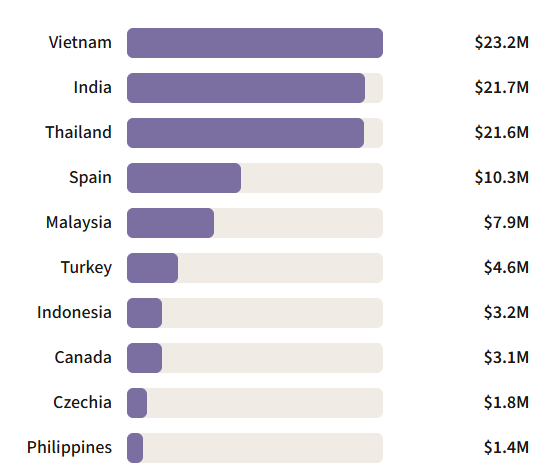
Within engineered quartz, the shift away from India continued. Indian shipments fell 42% to $21.7 million while Vietnam held the top spot at $23.2 million and Thailand surged 70% to $21.6 million. Malaysia gained 49% and Turkey 83%.
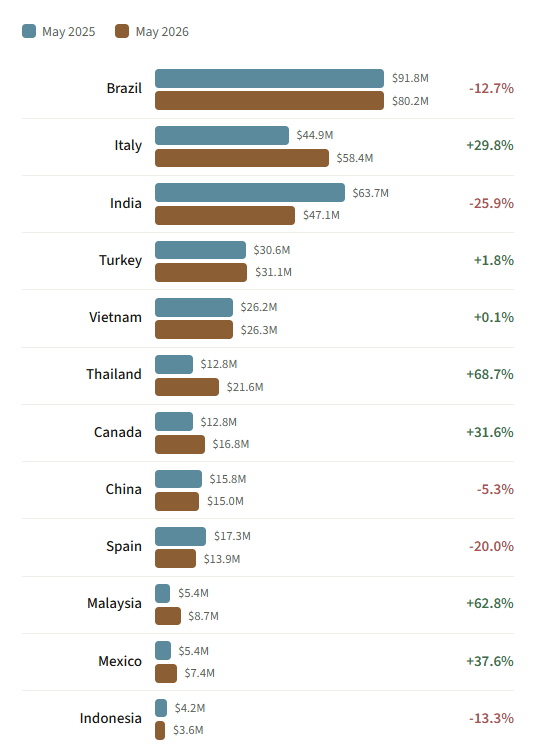
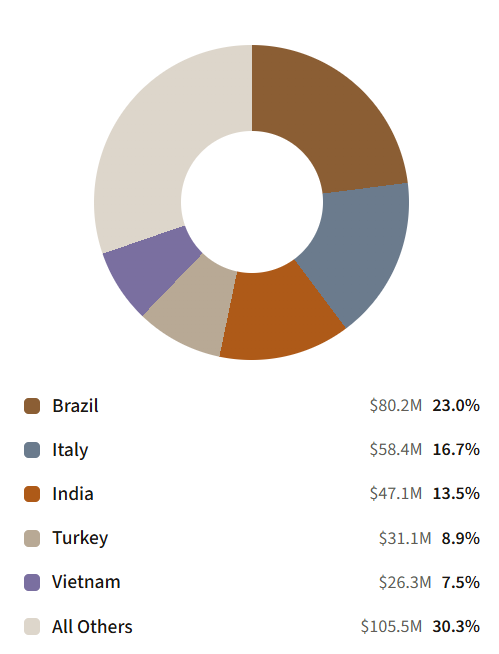
Brazil remained the largest overall source at $80.2 million despite a 12.7% decline. Italy ranked second at $58.4 million, up 29.8%, followed by India at $47.1 million, down 25.9%.

Natural Stone vs. Engineered Quartz
The Countertop Import Market
Natural stone climbs to 70 percent as engineered quartz keeps sliding
All Material Categories
Import value by stone type — May 2026
Year-Over-Year Comparison
Category Change: May 2025 → May 2026
Most categories gained — granite and engineered quartz did not
Country Change: May 2025 → May 2026
Top source countries — teal is May 2025, brown is May 2026
Material Deep Dive
Engineered Quartz: Source Countries
$104.5M in May — down 7.5% from a year ago
Natural Quartzite: Source Countries
$65.5M in May — up 4.3% from a year ago
Marble: Source Countries
Granite: Source Countries
$47.0M in May — down 20.8% YoY
Source Countries
What Each Country Actually Ships
Top 12 countries by material type — May 2026
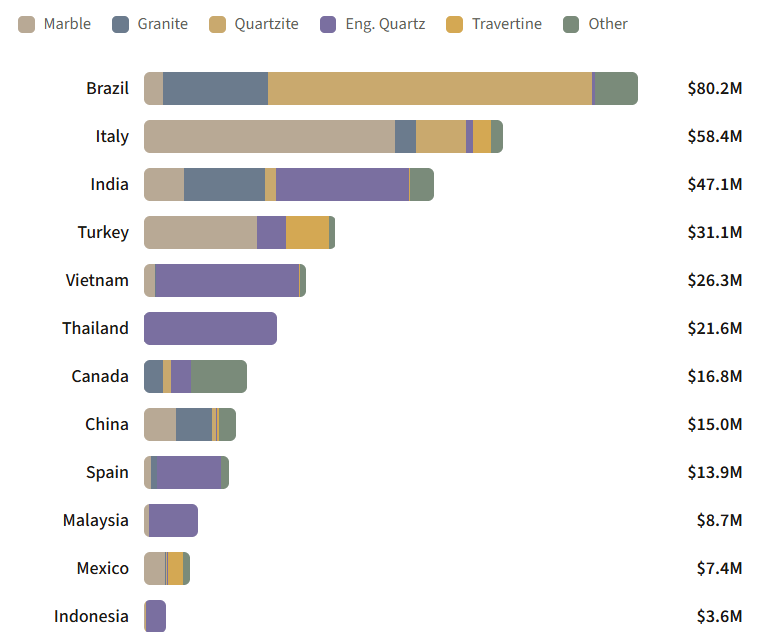
Market Concentration
Top 5 countries hold 69.7% of the market
Country Rankings — Full Breakdown
May 2026 countertop material imports by category with YoY change
Engineered Quartz Detail
Jumbo Slabs vs. Other Sizes
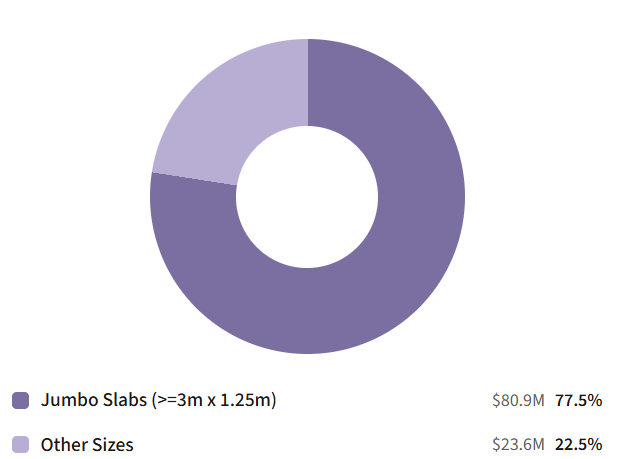
HTS 6810.99.00.20 (≥3m × 1.25m) vs. 6810.99.00.40 (other)
Engineered Quartz: Jumbo Slab Sources
Top countries for full-size countertop slabs (≥3m × 1.25m)