Photo Credit: Tryaging / iStock / Getty Images Plus / via Getty Images
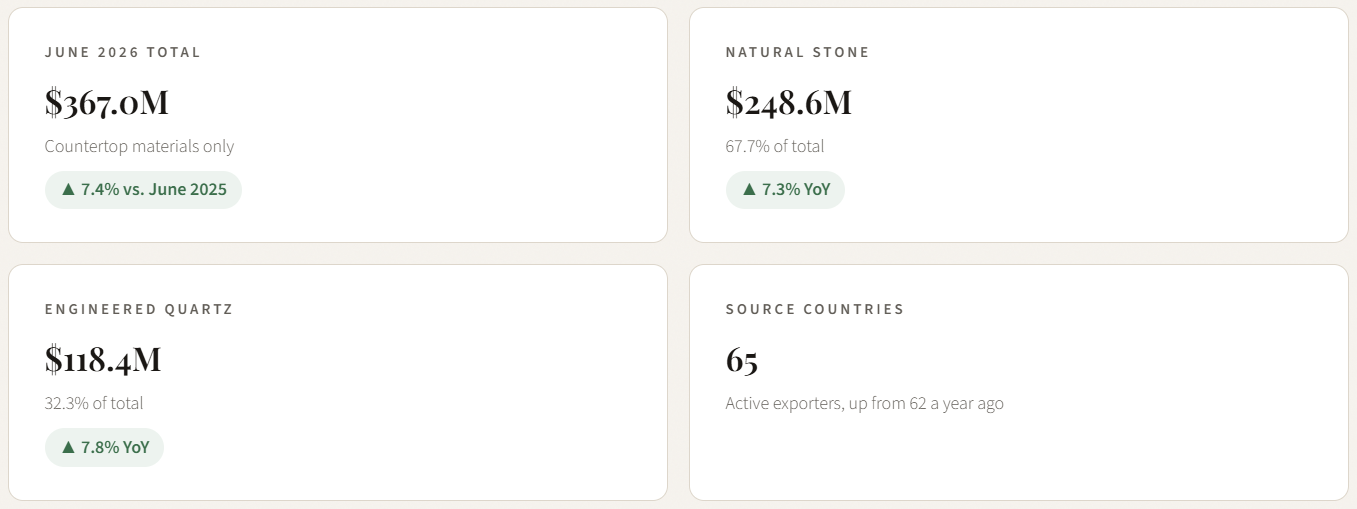
U.S. imports of countertop materials reached $367.0 million in June 2026, up 7.4 percent from the same month a year earlier, according to U.S. International Trade Commission data. Natural stone accounted for $248.6 million or 67.7 percent of the total while engineered quartz contributed $118.4 million or 32.3 percent. Both segments advanced, with natural stone rising 7.3 percent and engineered quartz climbing 7.8 percent.
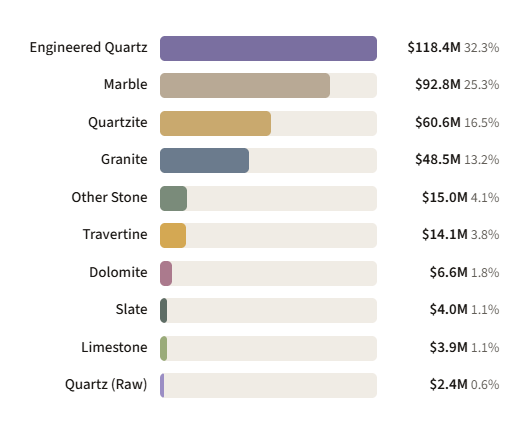
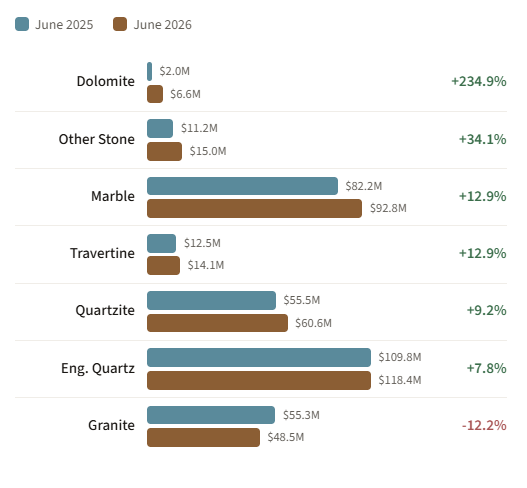
Marble led all natural stone categories at $92.8 million, a 12.9 percent year-over-year increase. Quartzite followed at $60.6 million, up 9.2 percent. Granite remained the weakest major category, falling 12.2 percent to $48.5 million. Travertine and other stone also posted gains while slate and limestone declined.
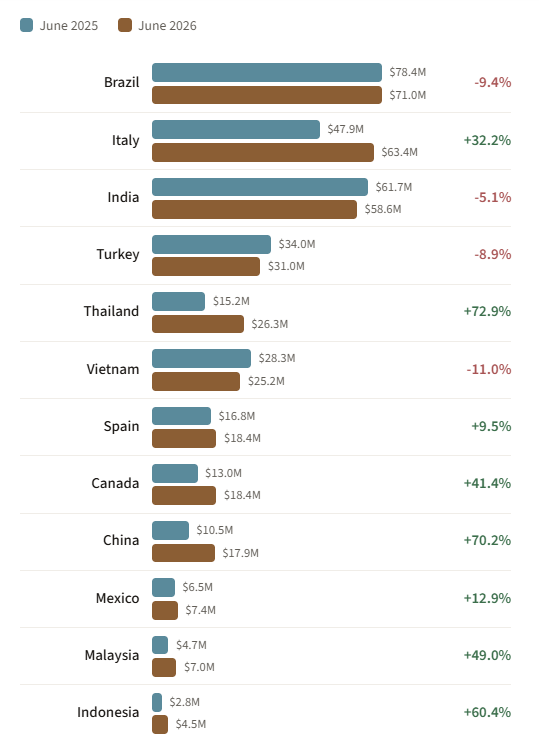
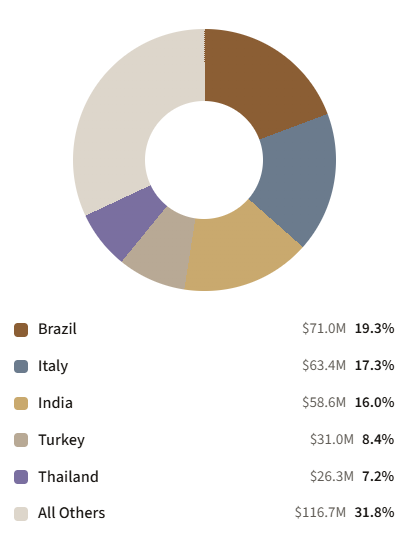
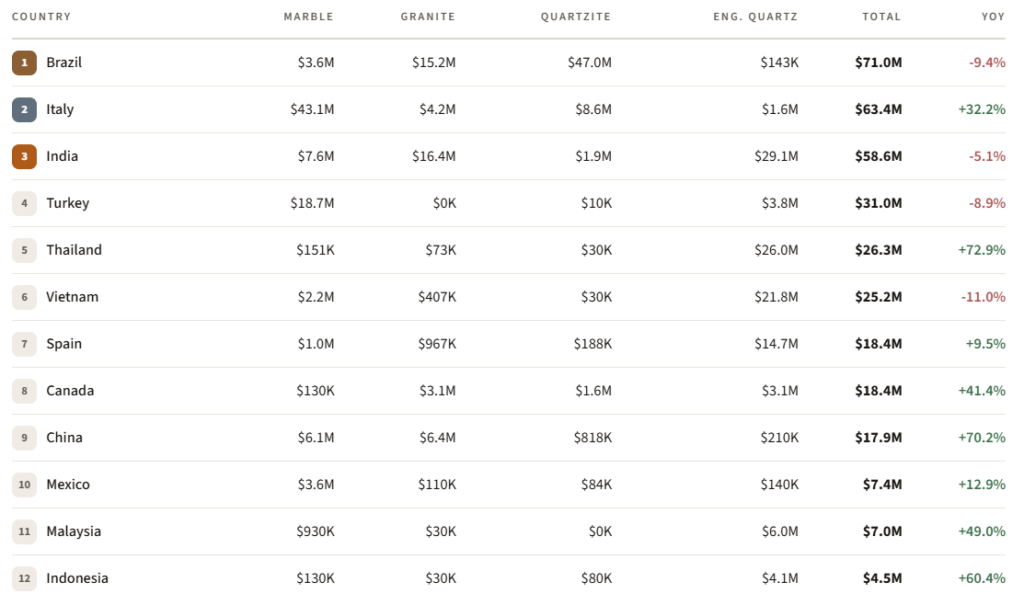
Brazil stayed the top source country at $71.0 million despite a 9.4 percent drop. Italy surged 32.2 percent to $63.4 million and Thailand jumped 72.9 percent to $26.3 million. India, Turkey and Vietnam all registered declines. The top five countries together supplied 68.2 percent of the market.
Natural Stone vs. Engineered Quartz
The Countertop Import Market
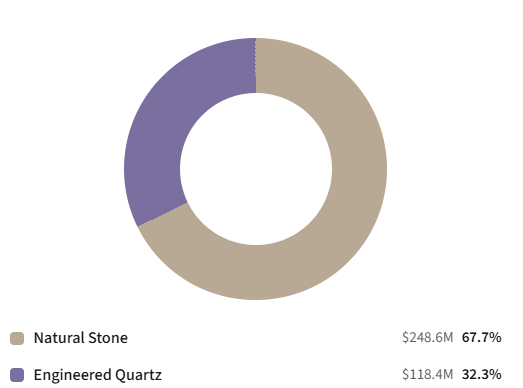
Both natural stone and engineered quartz advanced; natural stone holds 67.7 percent
Engineered quartz accounted for 32.2 percent of the countertop import market in June 2025 and held essentially the same share (32.3 percent) in June 2026 after a 7.8 percent value gain. Natural stone rose 7.3 percent and remains the dominant category at 67.7 percent. The overall market expanded 7.4 percent year over year to $367.0M.
All Material Categories
Import value by stone type — June 2026
Sandstone ($0.6M) omitted from the chart above for scale. Percentages are share of the $367.0M countertop total.
Year-Over-Year Comparison
Category Change: June 2025 → June 2026
Most categories gained — granite, slate and limestone did not
Dolomite’s 235 percent jump is driven almost entirely by Canada (crude and calcined dolomite). Treat the spike as shipment timing rather than a structural shift. Granite remains the clearest soft spot, down 12.2 percent and the only major worked-stone category in decline.
Country Change: June 2025 → June 2026
Top source countries — teal is June 2025, brown is June 2026
Italy added $15.5M and Thailand added $11.1M year over year, more than offsetting the combined $10.5M decline from Brazil, India, Turkey and Vietnam. Brazil remains the largest single source despite the 9.4 percent drop.
Material Deep Dive
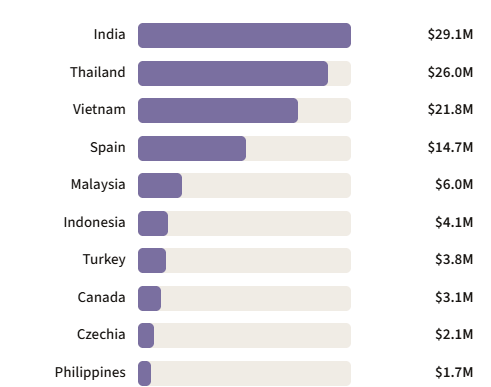
Engineered Quartz: Source Countries
$118.4M in June — up 7.8% from a year ago
India reclaimed the top spot at $29.1M. Thailand surged 73 percent overall (driven by engineered quartz) to $26.0M. Vietnam slipped but remains a major supplier. Spain, Malaysia and Indonesia all posted solid gains. Southeast Asia continues to expand its footprint in the engineered-quartz trade.
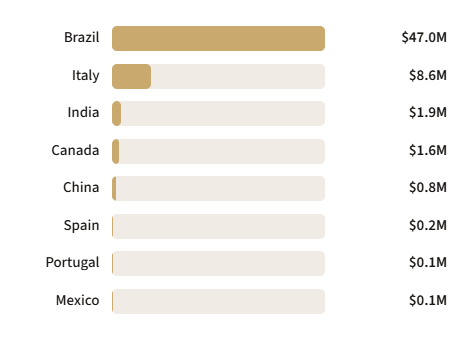
Natural Quartzite: Source Countries
$60.6M in June — up 9.2% from a year ago
Brazil supplied $47.0M of the $60.6M total (77.5 percent). Italy rose to $8.6M. Quartzite remains the second-largest natural-stone category and continues to outpace granite in absolute value.
Marble: Source Countries
$92.8M in June — up 12.9% YoY
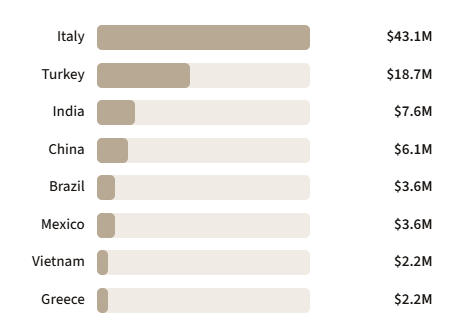
Italy alone accounted for nearly the entire category gain, rising to $43.1M. Turkey remained the clear No. 2. China and Mexico both posted healthy increases. Marble is now the largest single natural-stone category by a wide margin.
Granite: Source Countries
$48.5M in June — down 12.2% YoY
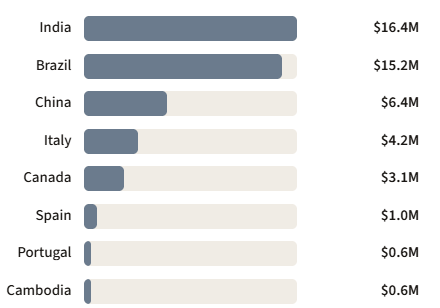
India edged Brazil for the top granite position. Both major suppliers declined year over year. China, Italy and Canada also posted lower volumes. Granite is the only large category still contracting.
Source Countries
What Each Country Actually Ships
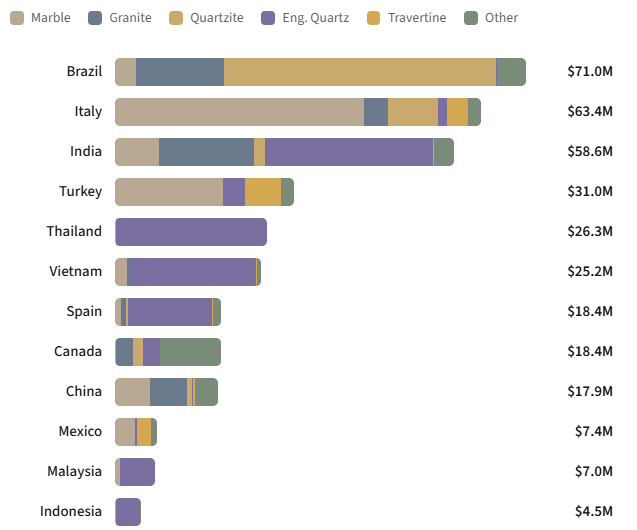
Top 12 countries by material type — June 2026
Bar length is total value; segments show the material mix within each country. Hover a segment for its category and value. Canada’s large “Other” share is mostly dolomite.
Market Concentration
Top 5 countries hold 68.2% of the market
Country Rankings — Full Breakdown
June 2026 countertop material imports by category with YoY change
Engineered Quartz Detail
Jumbo Slabs vs. Other Sizes
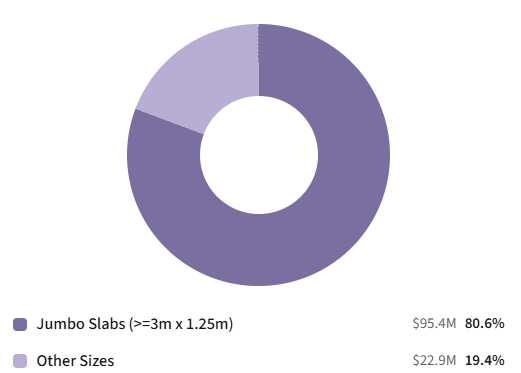
HTS 6810.99.00.20 (≥3m × 1.25m) vs. 6810.99.00.40 (other)
80.6 percent of engineered quartz arrives as standard jumbo slabs ($95.4M), confirming the bulk of these imports are destined for countertop fabrication.
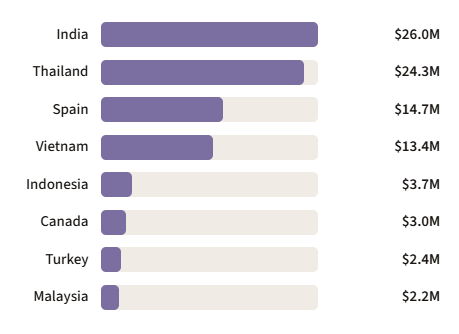
India leads jumbo-slab shipments at $26.0M, with Thailand close behind at $24.3M. Spain is a distant third at $14.7M. The top four countries account for more than 80 percent of all jumbo-slab volume.