

Article
Survey 2025: What the Retailers Think
Tuesday, July 8, 2025 from Floor Focus
In this 29th iteration of Floor Focus’ retailer survey, hundreds of retailers from around the country offered their expert advice on all aspects of the independent flooring retailer business as well as the residential flooring market in general and, beyond that, wrote in thoughtful commentary on the flooring industry, from a look back at strategic steps and missteps to the current state of the market to the direction residential retail needs to move in order to maximize its long-term prospects.
To put this year’s results in context, the residential flooring market has contracted over the last couple of years in line with activity in the housing market, driven by inflation and high mortgage rates. The higher end of the market, however, has outperformed across this timespan, as economic factors like higher interest rates and the costs of products and services have an outsized impact on the majority of consumers.
Top of mind for this year’s respondents were concerns about tariffs and the state of the economy. “We are worried about the tariffs causing instability,” one Connecticut-based retailer commented. A Florida dealer had a more urgent concern: “Hoping and praying that tariffs don’t kill our business.” In terms of the economy, a Montana retailer said, “It’s hard to get people excited about remodeling when it is so costly.” And a common refrain was that interest rates needed to come down to stimulate home sales.
Throughout the history of this survey, issues relating to installation have been the biggest source of frustration for the flooring retailer community. In recent years, with installation issues increasingly centered on the lack of qualified installers, there’s been more talk about flooring professionals in general aging out and the various effects of this trend, including not connecting with younger generations.
One respondent summed it up, “Everyone is getting old,” the point being that the industry is not being replenished by young blood. Several survey respondents expressed skepticism about the work ethic of Gen Z and Millennials. As one Indiana retailer put it, “The younger generation is not willing to put in the effort to learn a trade so that they can grow in the business.”
Another leading issue is learning how to satisfy those same generations as customers. “The customer is getting harder to please,” said a dealer from Mississippi. And a Florida retailer reported “finding it hard to attract younger customers,” opining that big box stores and the Internet seem to be their preferred choice.
Some dealers have unrealistic hopes—“Internet sales should not be allowed”; “Selling flooring online should not be!”—and some were more focused on adapting—“The flooring industry needs to embrace a digital footprint for the end users and retailer.”
Many retailers commented on some key trends in the residential flooring market, like how it’s all about price. “Manufacturers would help flooring retailers by making valuable flooring products, not a race to the bottom with low-price polyester or low-price SPC,” said one Sunbelt dealer.
And a dealer from Maine commented about completing this survey, “Is it over yet? You said it was shorter.” It was, in fact, shorter, though not by much, but yes, it’s over! And Floor Focus thanks you and all the other residential dealers who took the time to complete it.
WHO THEY ARE
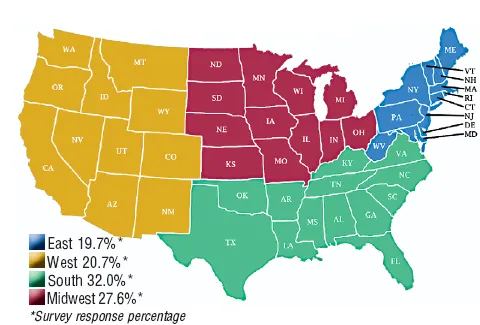
Like last year, the majority of responses (32.0%) in this year’s survey came from the South, followed by the Midwest at 27.6%, with the West at 20.7% and the East at 19.7%.
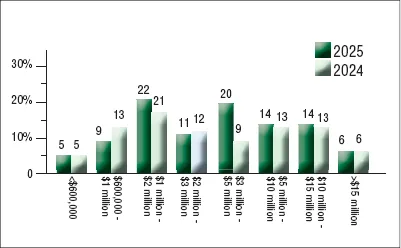
In terms of the size of their businesses, about 14% report annual revenues of $1 million or less, down from 18% last year and 24% in 2023. And at the other end, 53% report revenues of $3 million or more, compared to 49% last year and 44% in 2023. So, the general trend in terms of surveyed dealers has been toward larger operations.
Interestingly, and possibly related to the shift toward larger businesses, retailers both this year and last year report that revenues are up, despite the overall down market, by 4%. Only 42% reported that sales were flat or down.
■ REGIONAL BREAKDOWN
One has to wonder whether retailers are putting on a good face, since most other responses suggest pressure on their businesses. For instance, average earnings were down from 4.3% last year to 3.1% this year, and their priorities are shifting to focus on issues like competition from other retailers and other channels, which is a common response to reduced demand.
Also, elsewhere in the survey they reiterate their focus on improving margins as well as getting help recruiting RSAs. And installation issues dropped sharply this year as atop problem, a clear indication of diminishing demand.
■ ANNUAL SALES
■ DO YOU BELONG TO A RETAIL GROUP?
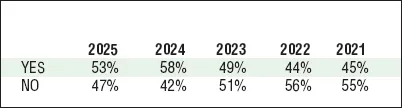
About 53% of this year’s respondents say they’re part of a retail buying group, which is down slightly from last year’s 58% but still well above the average over the last 15 years. In the East, 69% of respondents are in groups, with none of those not already in groups reporting any interest in joining one. In the West, where participation is typically lowest, only 41% of respondents reported being in groups, and, again, all of those not in groups intend to keep it that way. In the South, where 45% of respondents report being group members, 4% of those not in groups are considering joining one. And in the Midwest, 59% are in groups, and none of those not in groups plan to join one.
This year, 83% of survey respondents say they pay their installers as independent contractors (and 17% pay them as company employees), compared to 80% last year and 75% in 2023. It’s fairly even across the states, with 86% of respondents in the West and South paying installers as contractors, 85% in the East and 78% in the Midwest.
In terms of RSAs, nationally, 34% of surveyed retailers compensate their RSAs with straight salary, another 48% offer salary plus commission, and the rest, 18%, are straight commission. This year, straight salaries are highest in the South at 41%, followed by the Midwest at 37%, the East at 31% and the West at 24%. Straight commissions were highest in the West at 24%, then the Midwest at 17%, the South at 16% and the East at 14%.
WHAT THEY SELL
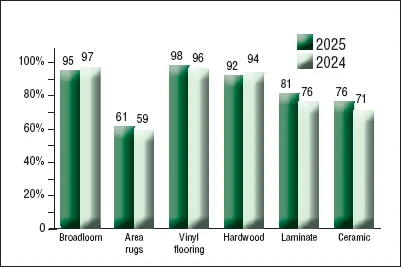
Most retailers carry a wide range of floorcoverings. This year, 95% report that they carry carpet. The other dominant category, vinyl flooring, is carried by 98% of this year’s respondents. Another well-represented category is hardwood, sold by 92% of responding retailers nationally.
While carpet, vinyl and hardwood results are about steady historically, one category that’s been on the rise is laminate flooring, carried by 81% of respondents this year compared to 76% last year, 72% in 2023 and 65% in 2022, reflecting the success of the category in raising its profile as an alternative to rigid core products.
■ WHAT THEY CARRY
■ WHAT THEY CARRY-REGIONAL SNAPSHOT
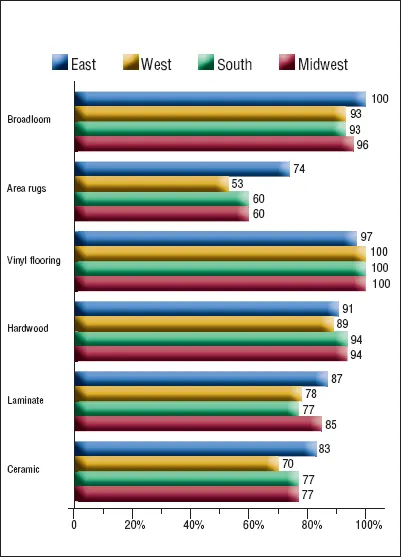
Despite the challenges involved in competing against online vendors like Wayfair, retailers have been increasing their rug offering over the last few years. For 2025, 61% of dealers said they offer rugs, which is up steadily from 59%, 58% and 48% over the last three years.
The other big category is ceramic tile, a lot of which is channeled through tile specialists, although 76% of the surveyed dealers say they offer tile.
And then there’s the ratio of what’s sold. When you combine rigid LVT, flex LVT and sheet goods, vinyl makes up the biggest piece of the pie, at 32% of average total flooring revenues this year. Sheet vinyl makes up only 2%, and this year flex LVT makes up 8% of total flooring sales, up from 5% just two years ago. Meanwhile, rigid LVT is still strong but not really growing, making up 22% of revenues of this year’s dealers, the same as last year but down from 26% in 2023.
This year, broadloom slid further, accounting for only 26% of average revenues, down from 31% a couple of years ago.
The flooring category with the biggest growth in sales over the last year among surveyed dealers is hardwood, accounting for 15% of revenues, up from 12% the last couple of years and 10% in 2021. In the builder market, hardwood is a go-to at the medium to higher end, where the market has been stronger. Hardwood was very strong in the South, West and East—at 19%, 18% and 17%, respectively—but only accounted for 6% of flooring sales in the Midwest.
■ SALES BY PRODUCT: HISTORICAL
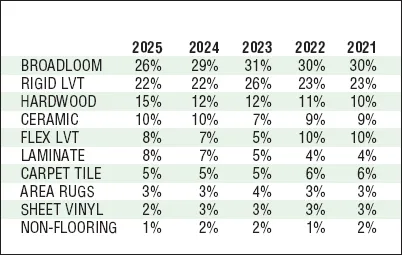
Ceramic tile was flat with last year at 10%, highest in the South at 12% and lowest in the Midwest at 8%. And laminate flooring was up one point from last year at 8%, but double where it stood just three years ago. Laminate was strongest in the West with 10% of flooring revenue share, and lowest in the Midwest at 6%.
■ SALES BY PRODUCT: SNAPSHOT
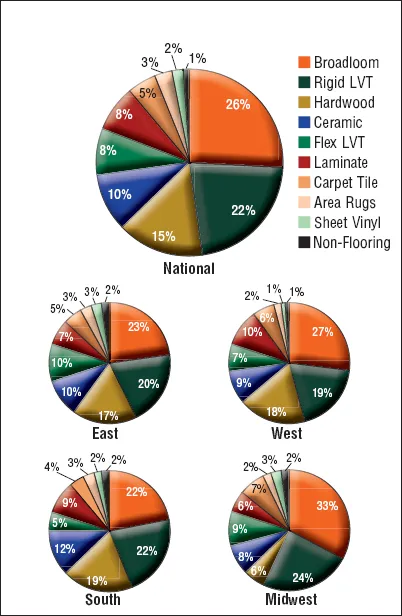
Area rug revenues were flat with last year at 3% of total flooring, but it’s the category itself that is shifting, with increasing demand, mostly at the higher end, for area rugs fabricated out of broadloom. It’s not a huge business—this year, retailers report that on average it accounts for 2.7% of revenues—but it’s growing. While 24% of respondents don’t generate any revenues from fabricated rugs, it makes up at least 10% of revenues for nearly 10% of surveyed dealers, and 17% of respondents claim it accounts for 20% or more of total flooring revenues. Overall, 76% of retailers say fabricated rugs provide a revenue stream. Revenues from fabricated rug business was up 8.4% on average.
Retailers were also asked to report on their fastest-growing categories. Vinyl led the way with over 32% of the vote, then laminates at over 27%, including a few votes for hybrid laminates. Next was hardwood, with 11.6% of dealers citing it as their fastest-growing category, and 10.6% cited ceramic tile, including large format tiles. Carpet clocked in just shy of 7%, with specific mentions of wool broadloom, nylon carpet and carpet tile, and 3.4% cited rugs, with two thirds of those votes specifically citing custom rugs and custom stair runners.
In terms of non-flooring products, top of the list was cabinets, then countertops, then window treatments. Also mentioned were kitchen and bath products in general.
This year, 76% of surveyed dealers believe that diversifying into other products will improve their bottom line, up from an average of 65% over the last few years, suggesting that retailers are looking for ways to boost revenues in the underperforming market. And nearly 70% of those respondents report that they have already diversified.
The usual suspects led the way—window treatments, followed by cabinets and countertops—with kitchen and bath products gaining the most ground this year. Interestingly, not a single respondent cited paint. Also mentioned frequently were furniture, lighting, outdoor products (including pavers and synthetic turf), followed by shower systems, cleaning and maintenance, and epoxy floors. In terms of flooring, custom rugs and runners, laminate, and resilient flooring garnered the most votes.
Of those that have not yet diversified, 68% report that they are not considering diversifying at all.
Floor Focus also asked dealers to cite noteworthy manufacturer products, displays, merchandising programs, websites, services and other features, and 42% of dealers responded.
This year, Shaw and Mohawk received about the same number of citations. In the case of Shaw, votes for Coretec led the way, followed by Shaw’s online presence. For Mohawk, there were votes for PureTech, Karastan, laminates in general and the Karastan brand. Also receiving plenty of votes was Stanton, including for its LVT, displays and Internet marketing. Visualizers received a lot of votes, three quarters of which were for Roomvo explicitly. Then there was CCA, including votes for the Carpet One website, Room by Room displays, selling systems and digital marketing.
Also receiving multiple mentions were Cali, Mirage and Mannington, including Phenix.
FOCUS ON SUSTAINABILITY
Most of the demand for sustainable flooring options comes from the commercial side. On the residential side, there is so far little traction. This year, retailers report that, on average, 6.3% of their customers buy flooring because of its green attributes, about the same as last year. About 17% say their customers never buy based on how green a product is, and 72% say that fewer than 10% of their customers buy green. At the other end, 10% of retailers say that at least 20% of their customers seek out sustainable flooring.
ON BUSINESS CHALLENGES
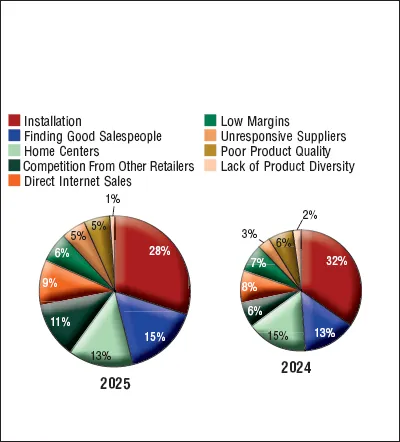
While installation remains the enduring top problem for retailers, it garnered fewer votes this year, likely reflecting the slowdown in the market, which, in turn, reduces pressure on the installer base. And there were more votes for finding good salespeople, which substantiates the proposition that business is slow, because in a slow market it’s more important than ever to have effective RSAs. One retailer noted, “The biggest challenge right now is finding qualified salespeople.”
There were nearly twice as many votes this year for competition from other retailers, jumping from 6% last year to 11% this year, again reflecting the tightness in the market and resulting increase in competitiveness.
The other big jump in votes, though from a smaller base, was regarding unresponsive suppliers, which went from 3% last year to 5% this year, and it included a few retailers citing issues with manufacturer lead times and having to wait too long to get products delivered.
Another 5% of the vote came from retailers writing in about tariffs and the economy. One wrote, “Please make the tariffs go away. Soon.”
One interesting result relates to poor product quality. It got 1% of the votes in 2020, 2% in 2021, 4% in 2022, 4% 2023, 6% in 2024, 5% 2025. The timing of the arc suggests that some of this could reflect the Issues with lower-end SPC installation failures, which the market started to address in earnest last year with a shift toward WPC, beefier SPC and even flex LVT and laminate.
■ TOP PROBLEMS
In this year’s survey, installation, while still the top issue, garnered fewer votes, while votes were up for competition from other retailers and the Internet, as well as for unresponsive suppliers.
Also mentioned: The economy (tariffs, mortgage rates, economic uncertainty), unrealistic customer expectations, store traffic
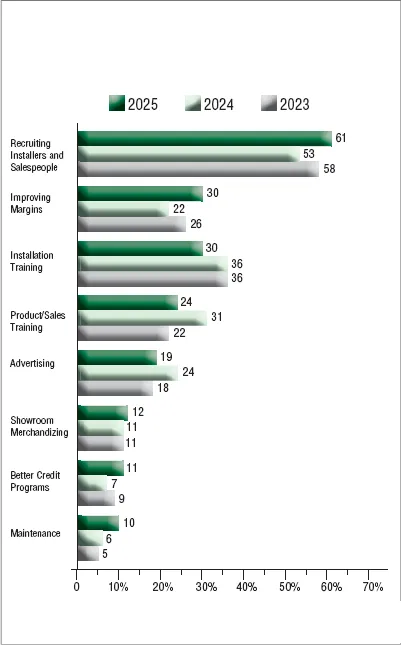
Floor Focus also asked retailers where they need the most help, and 61% cited the recruitment of installers and RSAs, up from 53% last year, and, interestingly, there was a drop in the need for help training those same individuals—installation training dropped to 30% from 36% last year, and RSA training dropped to 24% from 31%. This could mean that they haven’t had enough success finding these workers to be concerned about training them.
■ WHERE HELP IS NEEDED
Recruitment issues were up strongly from last year, as were improving margins, while there were fewer votes for installation training.
Also mentioned: training estimators, Store traffic, software upgrades, connecting with builders, “Reducing insurance premiums in all areas”
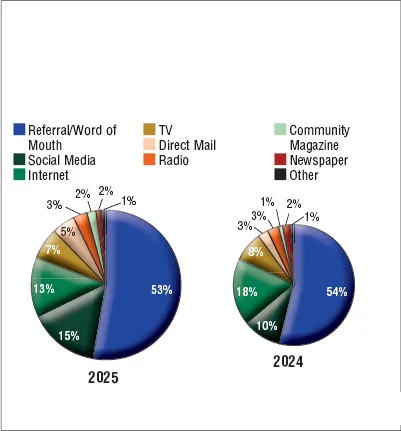
■ WHAT’S YOUR MOST EFFECTIVE FORM OF ADVERTISING?
Following a post-Covid slump, votes are up this year for social media, and from a smaller base, for direct mail and community magazines.
Also mentioned: Outdoor sign, being in the market and same location for decades
When it comes to advertising, flooring retailers have had some trouble historically getting their message out. They have been slow to adopt newer strategies, though in recent years most have acknowledged the value of increasing their Internet and social media visibility. This year, on average, respondents report spending 4.6% of their revenues on advertising, up from 4.0% last year.
Less than 6% say they spend nothing on advertising, and 43% spend from 1% to 5%, totaling 49% from 0% to 5%, compared to 78% last year. This is good news—flipping the numbers, last year, 22% spent more than 5% on advertising, and this year it’s 51%. In a down market, retailers usually pull back on advertising (to their own detriment), but it looks like this time around they’ve seen the light.
Word of mouth, which is a catch-all that includes referrals of any type—including, for instance, positive reviews on local apps like NextDoor—remains flooring retailers’ most effective form of advertising, cited by 53% of respondents. This year, votes for social media jumped 50% from 10% to 15%, and votes were also up for direct mail campaigns and advertising in local publications like community magazines.
■ WHAT ELEMENTS OF INTERNET MARKETING DO YOU USE?
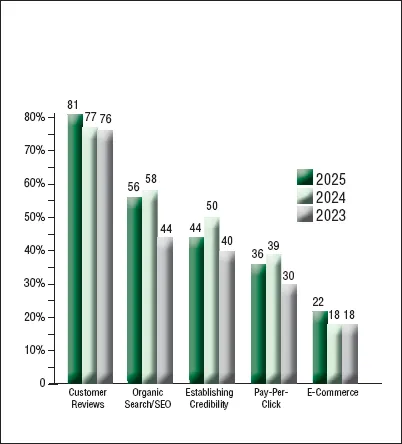
Customer reviews continue to gain, while every other Internet marketing use, except for e-commerce, is down.
Also mentioned: Social media in general, Facebook, Instagram
 ON THE INTERNET
This year, 92% of respondents report having their own websites, which is about the same as last year and up a few points over recent years. Still, one in 12 retailers do not have websites, which, in this day and age, is stunning.
When it comes to how retailers use the Internet, this year, votes for customer reviews were up to 81% from 77% last year, and votes slipped for everything else—organic searches and SEO, pay-per-click, establishing credibility—except for ecommerce, which of course is pretty much essential to business accounting these days..
■ THE WINNER
Respondents to the survey were entered into a drawing for a $500 cash award sponsored by Aquafil. This year’s
winner is:
Gary Weishaar, Showplace Floors Venice, Florida

■ ON BROADLOOM
■ FAVORITE CARPET COMPANY
SERVICE
Shaw easily won in service, as it has since the first survey in 1997. The top five ranking was unchanged since last year.
-
SHAW
-
MOHAWK
-
ENGINEERED FLOORS
-
THE DIXIE GROUP
-
STANTON
Also mentioned: Revolution, Mannington
QUALITY
Shaw topped the list for the 11th year in a row and, this year, Mohawk was a close second. The top five were unchanged.
-
SHAW
-
MOHAWK
-
THE DIXIE GROUP
-
ENGINEERED FLOORS
-
STANTON
Also mentioned: Marquis, Gulistan, Mannington
DESIGN
Stanton topped the list for design for the first time. Notably, in this category, the top three firms were separated by less than 1%.
-
STANTON
-
THE DIXIE GROUP
-
SHAW
-
MOHAWK
-
KANE
Also mentioned: Engineered Floors, Nourison, Milliken, Couristan
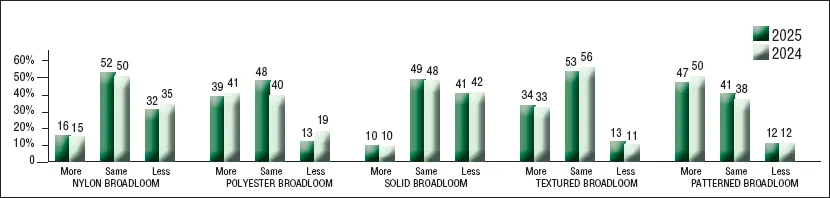
For the first time since Invista stopped making nylon 6,6, votes for nylon improved over the previous year, though it’s still losing share, while PET carpet was largely unchanged in its upward trajectory, with three times more retailers reporting increases compared to decreases. Solid color broadloom still seems to be flagging, while textured and patterned broadloom continue to make strong gains.
■ GAINERS AND LOSERS: BROADLOOM
ON RESILIENT
■ FAVORITE RESILIENT COMPANY
SERVICE
For the eighth year in a row, Shaw swept the resilient category. Mohawk held the second spot, while Karndean climbed up from Also Mentioned to third.
-
SHAW/CORETEC
-
MOHAWK
-
KARNDEAN
-
MANNINGTON
-
ENGINEERED FLOORS
Also mentioned: Cali, LW Flooring, Gaia, MSI, Paradigm, Stanton, The Dixie Group, Happy Feet, Tarkett
QUALITY
Shaw easily won in quality, and Mohawk stayed in second, while Mannington moved up a spot, and Stanton made the list for the first time ever.
-
SHAW/CORETEC
-
MOHAWK
-
MANNINGTON
-
KARNDEAN
-
STANTON
Also mentioned: Cali, Gaia, LW Flooring, Provenza, The Dixie Group, Paradigm, Tarkett, Engineered Floors
DESIGN
Shaw was unchallenged in design again this year. Both Mohawk and Mannington moved up a spot, and again Stanton made the top five for the first time.
-
SHAW/CORETEC
-
MOHAWK
-
MANNINGTON
-
KARNDEAN
-
STANTON
Also mentioned: Cali, Provenza, Paradigm, LW Flooring, Gaia, The Dixie Group, Tarkett, Engineered Floors, MSI, IFC
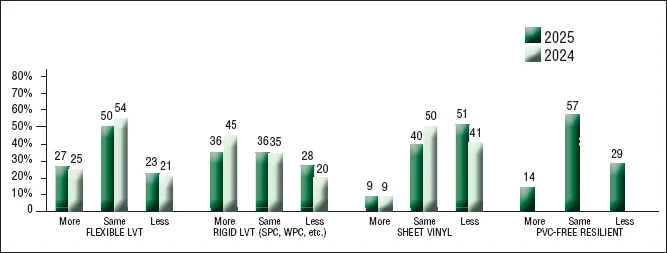
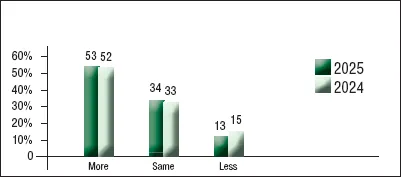
Rigid LVT’s gains slowed for the third year in a row, though the category is still growing. Sheet goods continued to lose ground, with five times as many losers as gainers. Flexible LVT is in the midst of a modest comeback, though we’ll have a better idea next year if significant long-term gains are likely. And for now, PVC-free resilient is not making a lot of inroads.
■ GAINERS AND LOSERS: RESILIENT
ON CERAMIC
■ FAVORITE CERAMIC COMPANY
SERVICE
Perennial winner Dal-Tile was again unchallenged in the top spot, and for the fifth consecutive year, Happy Floors came in second.
-
DAL-TILE/MOHAWK
-
HAPPY FLOORS
-
EMSER
-
FLORIDA TILE
-
MSI
Also mentioned: Surface Art, Shaw, Glazzio, Anatolia
QUALITY
Dal-Tile held the top spot, but the competition was stronger than ever, with Happy Floors second for the fifth year in a row, moving closer.
-
DAL-TILE/MOHAWK
-
HAPPY FLOORS
-
EMSER
-
FLORIDA TILE
-
SURFACE ART
Also mentioned: Crossville, MSI
DESIGN
For the first time in the history of the survey, there’s a new leader in the design category, with Happy Floors barely edging out Dal-Tile.
-
HAPPY FLOORS
-
DAL-TILE/MOHAWK
-
EMSER
-
CROSSVILLE
-
MSI
Also mentioned: Surface Art, Florida Tile, Anatolia, Glazzio
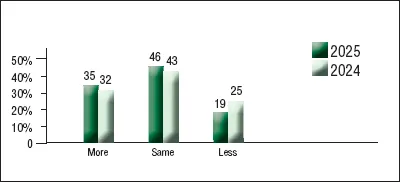
Just two years ago, ceramic was flat, with 26% reporting gains and 26% reporting losses, but the category has steadily moved into positive territory. This year, nearly twice as many survey respondents cited gains compared to those reporting losses.
■ GAINERS AND LOSERS: CERAMIC
ON HARDWOOD
■ FAVORITE HARDWOOD COMPANY
SERVICE
In a competitive field, Shaw held onto the top spot for the 15th year in a row. Mirage easily took second again, and Somerset/Boen moved up from Also Mentioned.
-
SHAW
-
MIRAGE
-
MOHAWK
-
AHF PRODUCTS
-
SOMERSET/BOEN
Also mentioned: Mannington, Hallmark, LW Flooring, Kährs, Lauzon, Riva, Wickham, Chelsea, Johnson, Provenza, DuChateau, Appalachian, Mullican, Bella Cera, The Dixie Group
QUALITY
For the fifth consecutive year, Mirage was voted first in quality, far ahead of the field. And Sweden’s Kährs made the top five for the first time, outpointing Mohawk.
-
MIRAGE
-
SHAW
-
AHF PRODUCTS
-
MANNINGTON
-
KÄHRS
Also mentioned: Mohawk, Somerset/Boen, DuChateau, Hallmark, Lauzon, Appalachian, Riva, Mercier, LW Flooring, Stanton, Provenza, Cali, Johnson, Bella Cera, Mullican, The Dixie Group
DESIGN
For the third year in a row, Mirage was the top vote-getter in design. Shaw held onto second, AHF moved from fifth to third, and Mannington jumped to the fourth spot.
-
MIRAGE
-
SHAW
-
AHF PRODUCTS
-
MANNINGTON
-
MOHAWK
Also mentioned: LW Flooring, Stanton, Kährs, Hallmark, Cali, Somerset/Boen, Johnson, Riva, Mullican, Bella Cera, Du-Chateau, Provenza, Appalachian, Chelsea, The Dixie Group
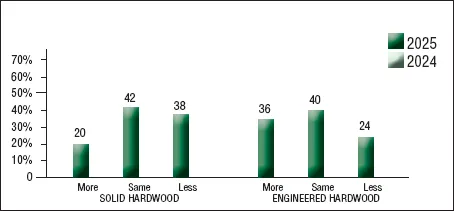
The domestic hardwood flooring market has over the years become increasingly dominated by engineered hardwood, with solid hardwood becoming more of a niche product, in part because of engineered wood’s superior performance on slab constructions. This year, while engineered’s gains were well ahead of losses, on the solid side nearly twice as many retailers said sales are down compared to those saying they’re up.
■ GAINERS AND LOSERS: HARDWOOD
ON LAMINATE
■ FAVORITE LAMINATE COMPANY
SERVICE
For the 16th consecutive year, Mohawk swept laminate—in the strongest lead across all flooring categories. LW Flooring and Stanton made the list for the first time.
-
MOHAWK
-
MANNINGTON
-
SHAW
-
LW FLOORING
-
STANTON
Also mentioned: Gaia, Engineered Floors, Republic
QUALITY
For 13 years in a row, the order of the top three has been unchanged. Stanton and LW Flooring took the final two spots this year, both making the list for the first time.
-
MOHAWK
-
MANNINGTON
-
SHAW
-
STANTON
-
LW FLOORING
Also mentioned: Gaia, Kaindl, Casabella
DESIGN
Mohawk and Mannington have topped this list since 2013. This year, Cali was ranked for the second time, and, again, LW Flooring and Stanton made the top five for the first time.
-
MOHAWK
-
MANNINGTON
-
STANTON
-
CALI
-
LW FLOORING
Also mentioned: Gaia, Kaindl
■ GAINERS AND LOSERS: LAMINATE
■ FAVORITE SUPPLIERS
Taylor held onto the top spot in adhesives, with the next three spots the same as last year. For the 12th year in a row, Crain led in installation equipment, though Roberts/QEP was close behind. Schluter easily won in accessories again. And for the 20th consecutive year, Bona was first in cleaning equipment and supplies.
ADHESIVES
-
TAYLOR
-
MAPEI
-
HENRY/ARDEX
-
BOSTIK
Also mentioned: Sika/DriTac, Shaw, Bona, Mohawk, TEC/Fortane
INSTALLATION EQUIPMENT
-
CRAIN
-
ROBERTS/QEP
-
SCHLUTER
Also mentioned: Rubi
ACCESSORIES
-
SCHLUTER
-
VERSATRIM
-
TARKETT/JOHNSONITE
Also mentioned: Shaw, Roberts/QEP, Mohawk, Artistic Finishes
CLEANING EQUIPMENT/SUPPLIES
-
BONA
-
MILLIKEN
-
SHAW
-
HOST/RACINE
Also mentioned: Armstrong, Mohawk