
Article
Personal Income and Outlays, October and November 2025
Thursday, January 22, 2026 from BEA
Personal income increased $30.6 billion (0.1 percent at a monthly rate) in October, followed by an increase of $80.0 billion (0.3 percent) in November, according to estimates released today by the U.S. Bureau of Economic Analysis. Disposable personal income (DPI)—personal income less personal current taxes—increased $12.0 billion (0.1 percent) in October, followed by an increase of $63.7 billion (0.3 percent). Personal consumption expenditures (PCE) increased $98.6 billion (0.5 percent), followed by an increase of $108.7 billion (0.5 percent).
Due to the recent government shutdown, this report for October and November replaces releases originally scheduled for November 26 and December 19, 2025.
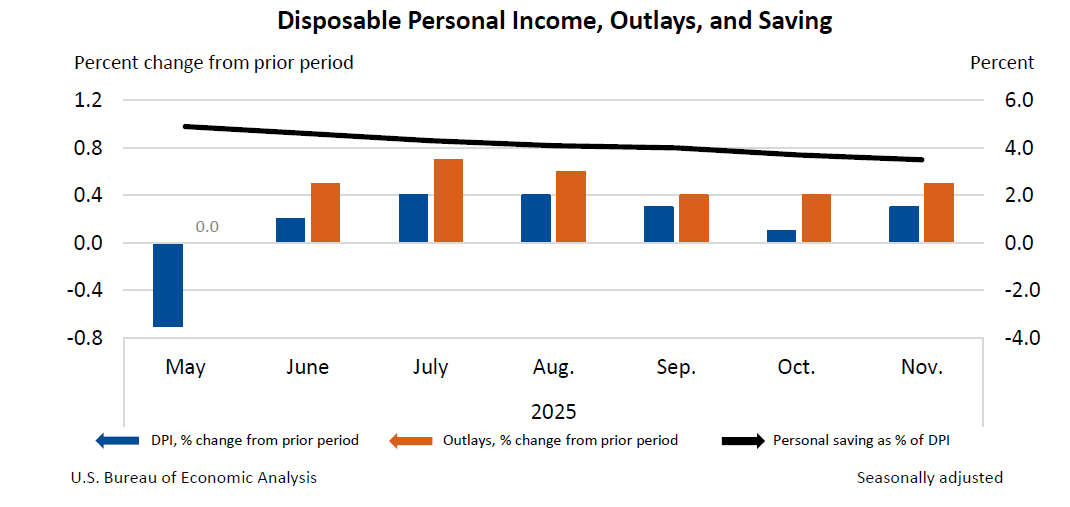
Personal outlays—the sum of PCE, personal interest payments, and personal current transfer payments—increased $97.8 billion in October, followed by an increase of $107.9 billion in November. Personal saving was $843.9 billion followed by $799.7 billion. The personal saving rate—personal saving as a percentage of disposable personal income—was 3.7 percent followed by 3.5 percent.
The increase in current-dollar personal income in October primarily reflected increases in compensation and government social benefits that were partly offset by decreases in other current transfer receipts from business, farm proprietors’ income, and personal dividend income. In November, the increase primarily reflected increases in compensation and personal dividend income.
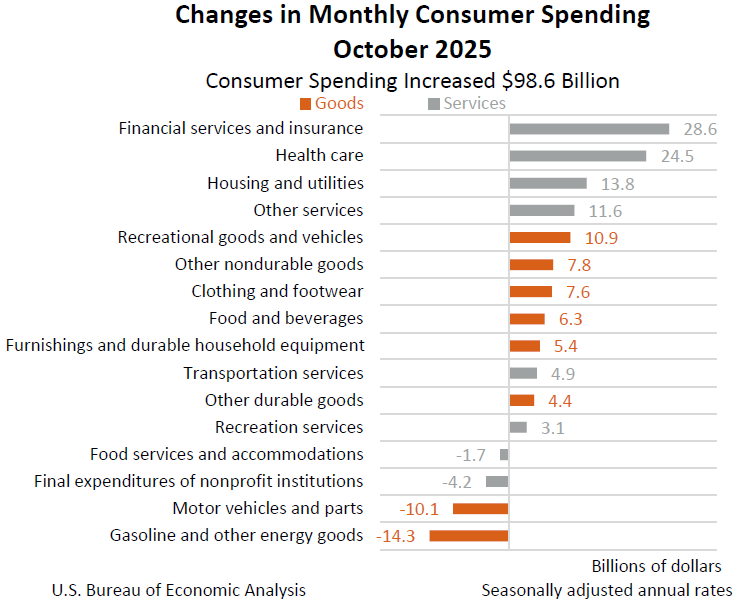
In October, the $98.6 billion increase in current-dollar PCE reflected increases in both services and goods.
- The increase in spending on services was led by financial services and insurance, health care, and housing and utilities.
- The increase in spending on goods was led by recreational goods and vehicles, other nondurable goods, and clothing and footwear.
In November, the $108.7 billion increase in current-dollar PCE reflected increases in both services and goods.
- The increase in spending on services was led by health care, financial services and insurance, and other services.
- The increase in spending on goods was led by gasoline and other energy goods as well as motor vehicles and parts.

From the preceding month, the PCE price index increased 0.2 percent in both October and November. Excluding food and energy, the PCE price index also increased 0.2 percent in both months. (Refer to “Technical Notes” below for information on how BEA imputed missing BLS October prices.)
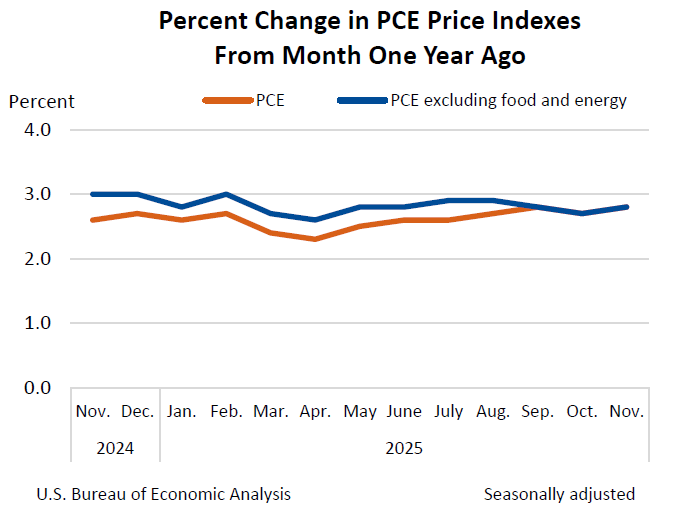
From the same month one year ago, the PCE price index increased 2.7 percent in October, followed by an increase of 2.8 percent in November. Excluding food and energy, the PCE price index also increased 2.7 percent followed by an increase of 2.8 percent.
| Personal Income and Related Measures [Percent Change From Preceding Month] |
||||
|---|---|---|---|---|
| October | November | |||
| Current-dollar personal income | 0.1 | 0.3 | ||
| Current-dollar disposable personal income | 0.1 | 0.3 | ||
| Real disposable personal income | -0.1 | 0.1 | ||
| Current-dollar personal consumption expenditures (PCE) | 0.5 | 0.5 | ||
| Real PCE | 0.3 | 0.3 | ||
| PCE price index | 0.2 | 0.2 | ||
| PCE price index, excluding food and energy | 0.2 | 0.2 | ||
|
||||
Upcoming improvements to the PIO news release
Next release: February 20, 2026, at 8:30 a.m. EST
Personal Income and Outlays, December 2025