
No products in the cart.
Article
Gross Domestic Product, Third Quarter 2022 (Advance Estimate)
Gross Domestic Product, Third Quarter 2022 (Advance Estimate)
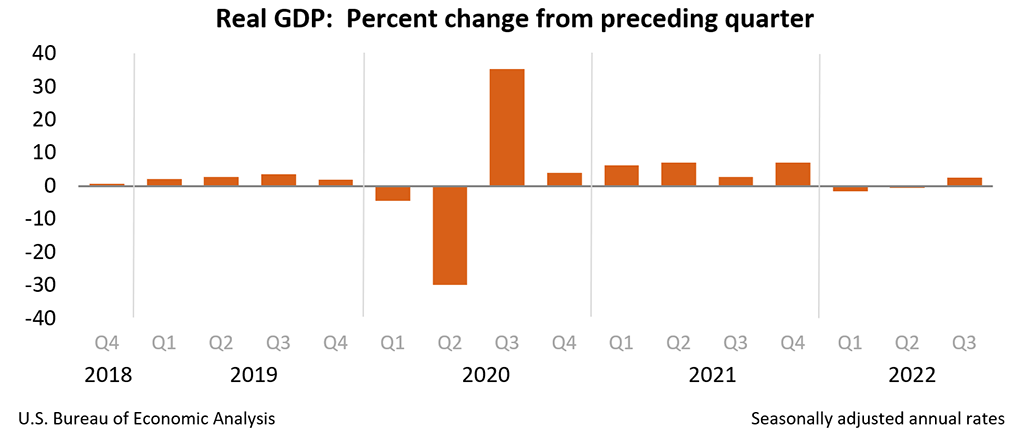
Real gross domestic product (GDP) increased at an annual rate of 2.6 percent in the third quarter of 2022 (table 1), according to the “advance” estimate released by the Bureau of Economic Analysis. In the second quarter, real GDP decreased 0.6 percent.
The GDP estimate released today is based on source data that are incomplete or subject to further revision by the source agency (refer to “Source Data for the Advance Estimate” on page 3). The “second” estimate for the third quarter, based on more complete data, will be released on November 30, 2022.
The increase in real GDP reflected increases in exports, consumer spending, nonresidential fixed investment, federal government spending, and state and local government spending, that were partly offset by decreases in residential fixed investment and private inventory investment. Imports, which are a subtraction in the calculation of GDP, decreased (table 2).
The increase in exports reflected increases in both goods and services. Within exports of goods, the leading contributors to the increase were industrial supplies and materials (notably petroleum and products as well as other nondurable goods), and nonautomotive capital goods. Within exports of services, the increase was led by travel and “other” business services (mainly financial services). Within consumer spending, an increase in services (led by health care and “other” services) was partly offset by a decrease in goods (led by motor vehicles and parts as well as food and beverages). Within nonresidential fixed investment, increases in equipment and intellectual property products were partly offset by a decrease in structures. The increase in federal government spending was led by defense spending. The increase in state and local government spending primarily reflected an increase in compensation of state and local government employees.
Within residential fixed investment, the leading contributors to the decrease were new single-family construction and brokers’ commissions. The decrease in private inventory investment primarily reflected a decrease in retail trade (led by “other” retailers). Within imports, a decrease in imports of goods (notably consumer goods) was partly offset by an increase in imports of services (mainly travel).
Real GDP turned up in the third quarter, increasing 2.6 percent after decreasing 0.6 percent in the second quarter. The upturn primarily reflected a smaller decrease in private inventory investment, an acceleration in nonresidential fixed investment, and an upturn in federal government spending that were partly offset by a larger decrease in residential fixed investment and a deceleration in consumer spending. Imports turned down.
Current‑dollar GDP increased 6.7 percent at an annual rate, or $414.8 billion, in the third quarter to a level of $25.66 trillion. In the second quarter, GDP increased 8.5 percent, or $508.0 billion (tables 1 and 3).
The price index for gross domestic purchases increased 4.6 percent in the third quarter, compared with an increase of 8.5 percent in the second quarter (table 4). The PCE price index increased 4.2 percent, compared with an increase of 7.3 percent. Excluding food and energy prices, the PCE price index increased 4.5 percent, compared with an increase of 4.7 percent.
Personal Income
Current-dollar personal income increased $291.2 billion in the third quarter, compared with an increase of $305.7 billion in the second quarter. The increase primarily reflected increases in compensation (led by private wages and salaries) and personal income receipts on assets (table 8).
Disposable personal income increased $268.3 billion, or 6.0 percent, in the third quarter, compared with an increase of $253.3 billion, or 5.7 percent, in the second quarter. Real disposable personal income increased 1.7 percent, in contrast to a decrease of 1.5 percent.
Personal saving was $626.1 billion in the third quarter, compared with $629.0 billion in the second quarter. The personal saving rate—personal saving as a percentage of disposable personal income—was 3.3 percent in the third quarter, compared with 3.4 percent in the second quarter.
Source Data for the Advance Estimate
Information on the source data and key assumptions used in the advance estimate is provided in a Technical Note that is posted with the news release on BEA’s website. A detailed “Key Source Data and Assumptions” file is also posted for each release. For information on updates to GDP, refer to the “Additional Information” section that follows.